Tag: Breakout Trap

  • Live Briefing #002-The 1.272-1.618 Liquidity Code: The Bitcoin Pattern That Cost Traders Millions

    Retail traders love to believe that the market moves on news, tweets, or random chaos. But if you know how to read session liquidity, you quickly realize the market is governed by a highly precise, algorithmic design.

    Price does not move randomly; it moves strictly from one liquidity pool to another, using math to trap the maximum number of breakout traders. Let’s break down the mechanics using the recent 15-minute Bitcoin chart.

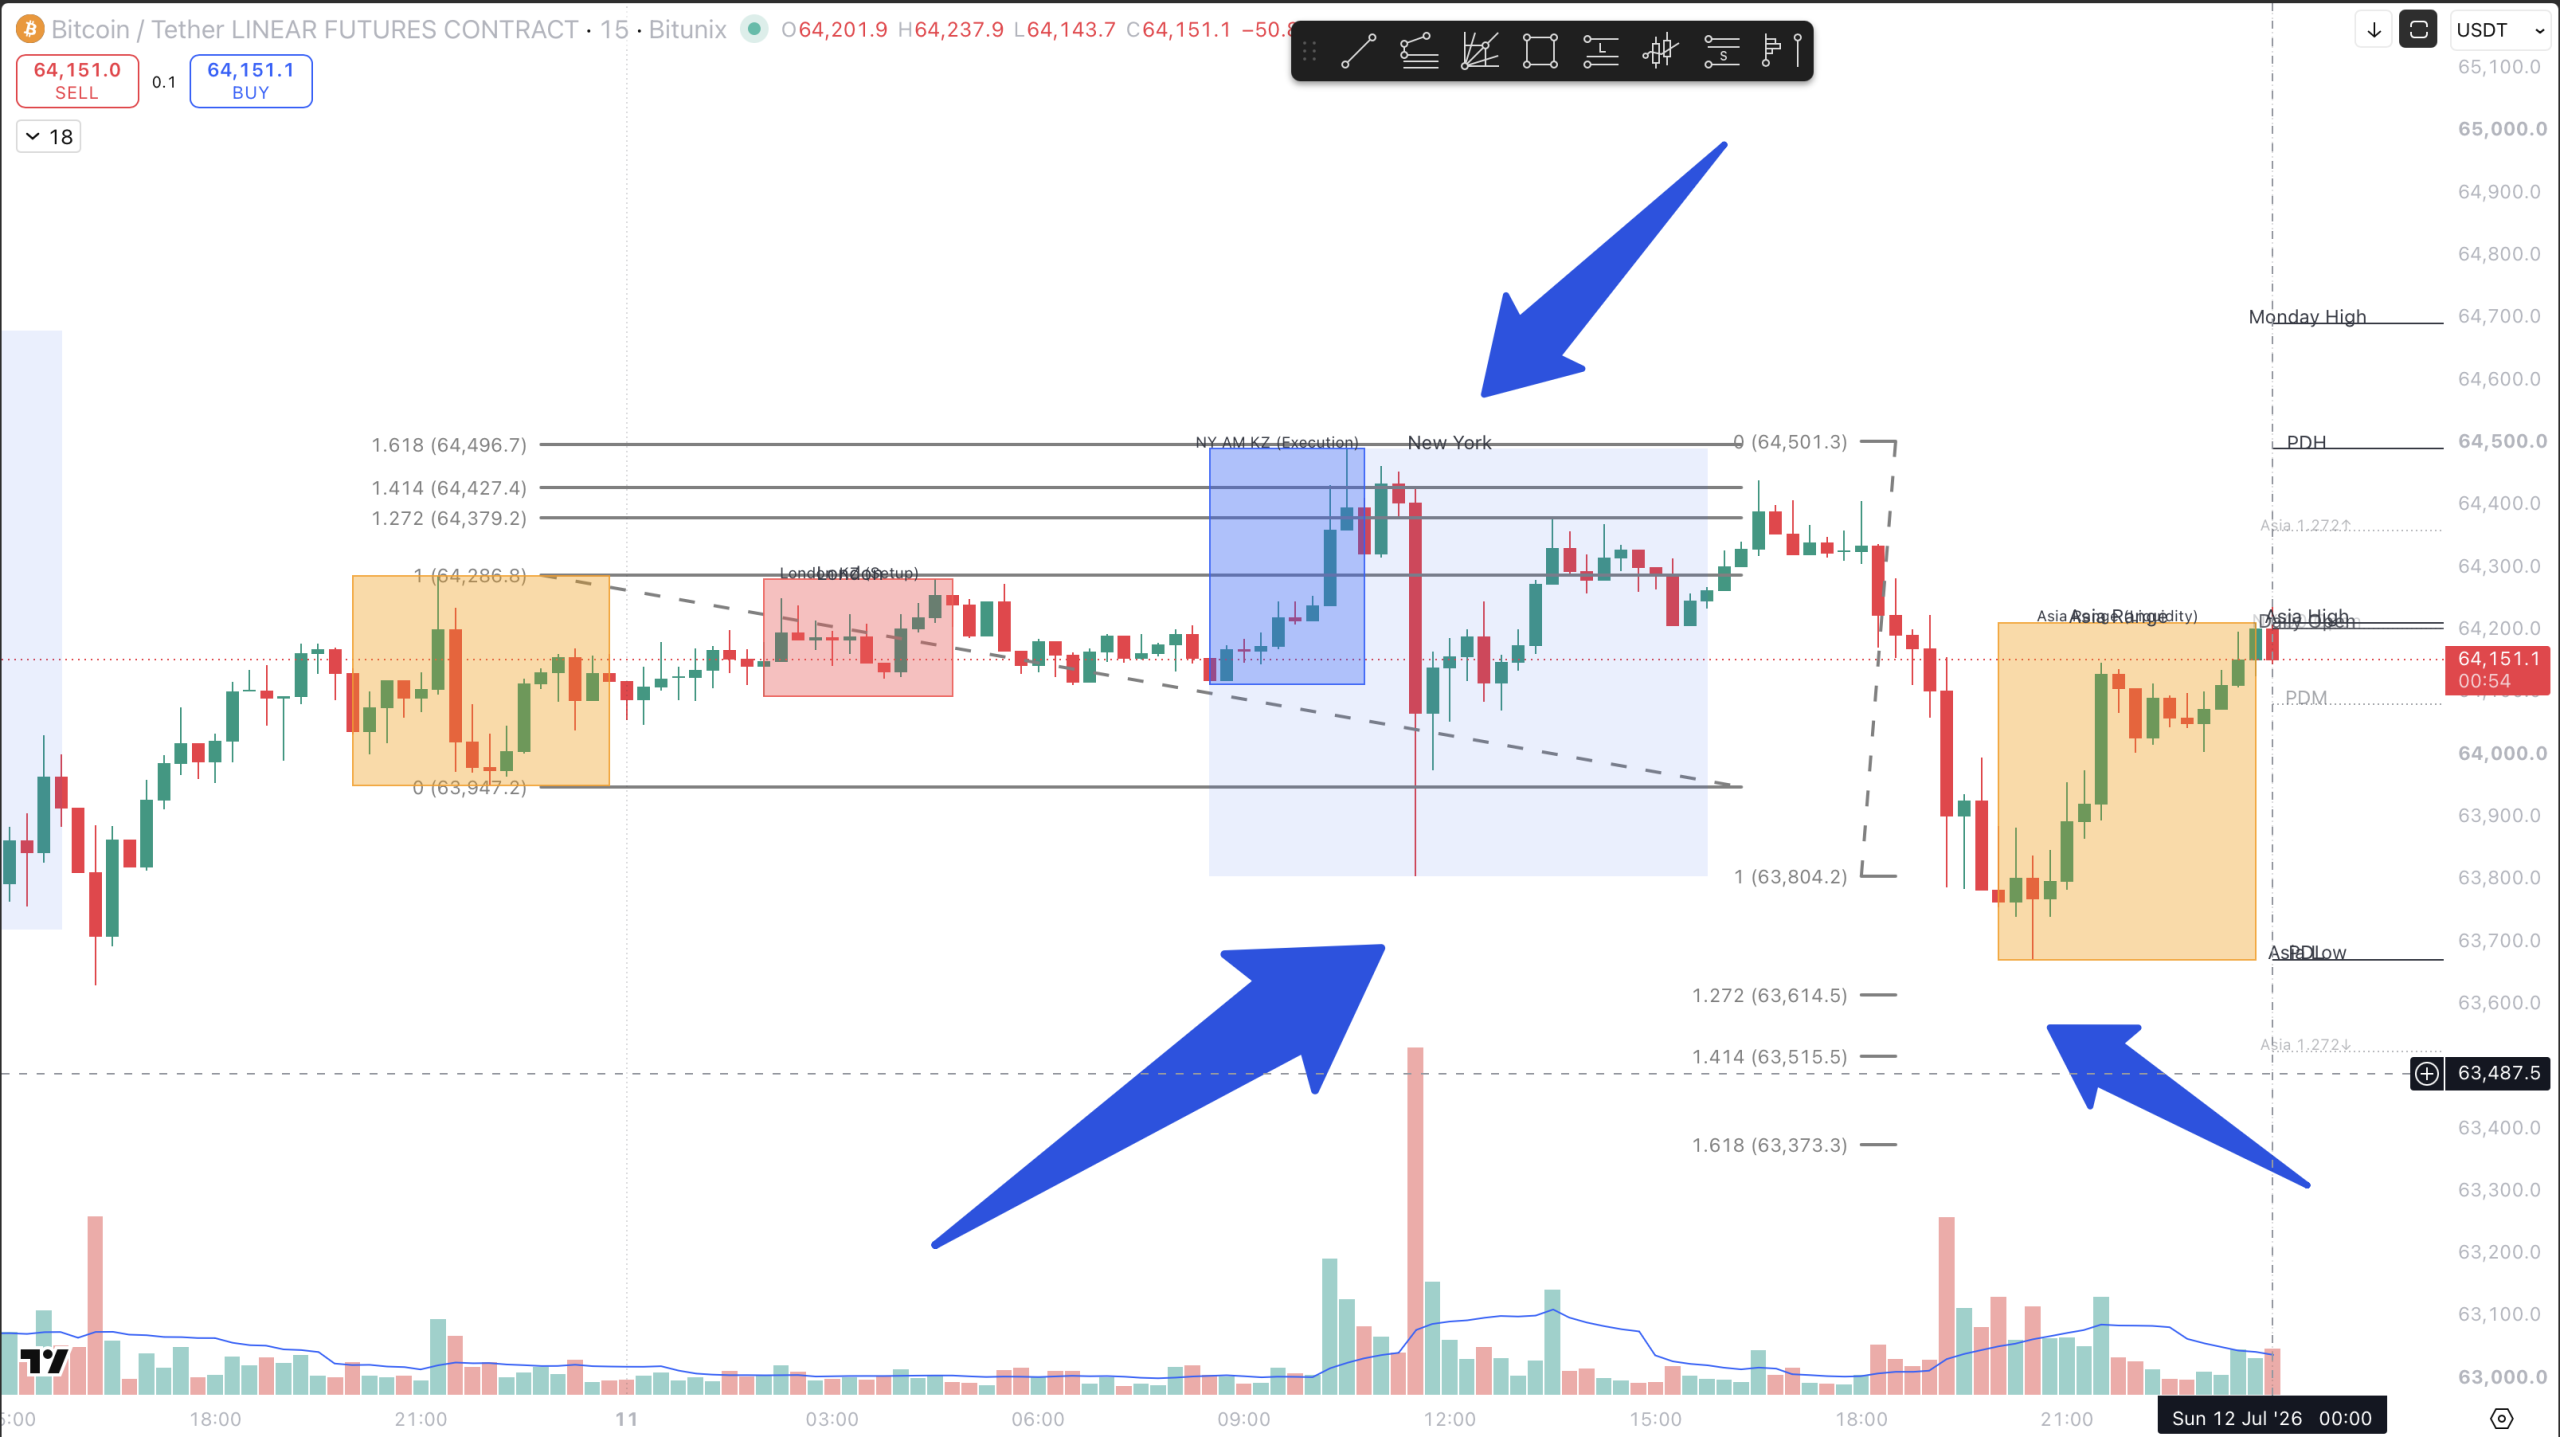
    Yesterday’s Script: The Asian Range 1.272 Double Trap

    To understand today’s live price action, we must analyze the perfect blueprint engineered yesterday. The algorithm utilized the Asian Session High and Low as its primary structural liquidity boundaries.

    1. The Upside Trap: During the New York session, the price aggressively broke above the Asian session high. To the untrained retail eye, this looked like a confirmed bullish breakout. However, the algorithm was simply expanding the range to the exact 1.618 Fibonacci Extension level to sweep the Buy-Side Liquidity (BSL). Once the stops were hunted, the price aggressively reversed downward.
    2. The Downside Trap: After collapsing back through the range, the price sliced below the Asian session low, triggering breakout shorts and hunting the stop-losses of late buyers. Again, notice where the decline halted: precisely at the 1.618 Fibonacci Extension level of the Asian range. A massive Sell-Side Liquidity (SSL) sweep occurred, followed by an immediate structural reversal back to the upside.

    Today’s Continuity: Hunting Yesterday’s New York Low

    The algorithm repeats the exact same code day after day. Today, the reference points shifted from the Asian range to Yesterday’s New York Session High and Low.

    Look closely at the current live price action. The market pushed downward, targeting the liquidity resting below yesterday’s NY low. Once again, it did not just stop anywhere—it dropped into the exact 1.272 extension zone of yesterday’s NY range, engineering a perfect liquidity sweep.

    As soon as the institutional orders filled by absorbing the retail panic-selling, the price immediately reversed and is now expanding back upward.

    The Core Law: Price Follows Liquidity

    This is the ultimate proof that price is simply an engineering tool designed to hunt liquidity. Breakout traders trading textbook chart patterns are the fuel for these movements.

    • The Breakout is the Trap: When a key level breaks, it is rarely a sign of continuation; it is usually an invitation for retail liquidity to enter the market so Smart Money can fill their opposing orders.
    • The 1.272-1.618 Zone is the Key: The 1.272 expansion is the mathematical sweet spot where algorithms frequently execute these stop-hunts before reversing the trend.

    Conclusion: Stop chasing the momentum after a breakout occurs. Map your session highs and lows, plot your 1.272-1.618 extension zones, and wait for the sweep confirmation. Let the algorithm trap the retail crowd first, and then trade alongside the Smart Money.