Tag: Stop Hunt

  • [Candles]Are Footprints: Reading Liquidity, Volume, and Institutional Intent

    Most retail traders fail because they memorize candlestick patterns like “Hammers” and “Shooting Stars” from a textbook.

    But in real market conditions, a candlestick is rarely just a pattern. It is a footprint of liquidity, order flow, volume, absorption, and structural intent.

    Textbook patterns often appear around areas where retail liquidity is concentrated. That is why traders must stop looking only at the shape of the candle and start asking a deeper question:

    What was the market trying to accomplish with this candle?

    To trade with a structural mindset, we must decode candlesticks through the lens of Liquidity, ICT concepts, and Wyckoff volume logic.

    1. The Wick Is More Than Rejection: It May Be a Liquidity Sweep

    Retail traders are often taught that a long wick represents “price rejection” at support or resistance.

    In structural trading, a wick can mean much more.

    A long wick may be the footprint of a stop hunt, a liquidity sweep, or an absorption event.

    When you see a long lower wick, like a hammer candle, it does not automatically mean buyers stepped in. It may mean price was intentionally driven below a previous structural low to trigger sell-side liquidity.

    Smart money cannot build large positions without liquidity. If they want to buy, they need sellers. By sweeping below a prior low, the market can trigger stop-losses, force breakout sellers into the move, and create the liquidity needed for larger participants to absorb orders.

    Rule: Do not trade a hammer simply because it is a hammer. Trade it only if the wick swept a meaningful liquidity pool and the market shows confirmation afterward.

    2. The Body Shows Intent: Displacement and Acceptance

    If the wick shows where liquidity was attacked, the body shows where price was accepted.

    A large full-bodied candle with little wick often represents strong directional intent. In ICT language, this type of aggressive movement is often described as displacement.

    Displacement is important because it shows that price is not just probing a level — it is repricing away from it.

    A strong-bodied candle breaking through a major structural zone may suggest participation beyond ordinary retail activity. It can also leave behind inefficiencies such as Fair Value Gaps or imbalances.

    But not every breakout is confirmation.

    When a level is broken only by a wick, it may be a trap. When a level is broken by a strong body, followed by acceptance, continuation, or a successful retest, it may signal a meaningful shift in market structure.

    3. The Doji Anomaly: Wyckoff’s Effort vs. Result

    A Doji or Spinning Top is often described as “market indecision.”

    But Wyckoff logic asks a deeper question:

    How much effort was required to produce that result?

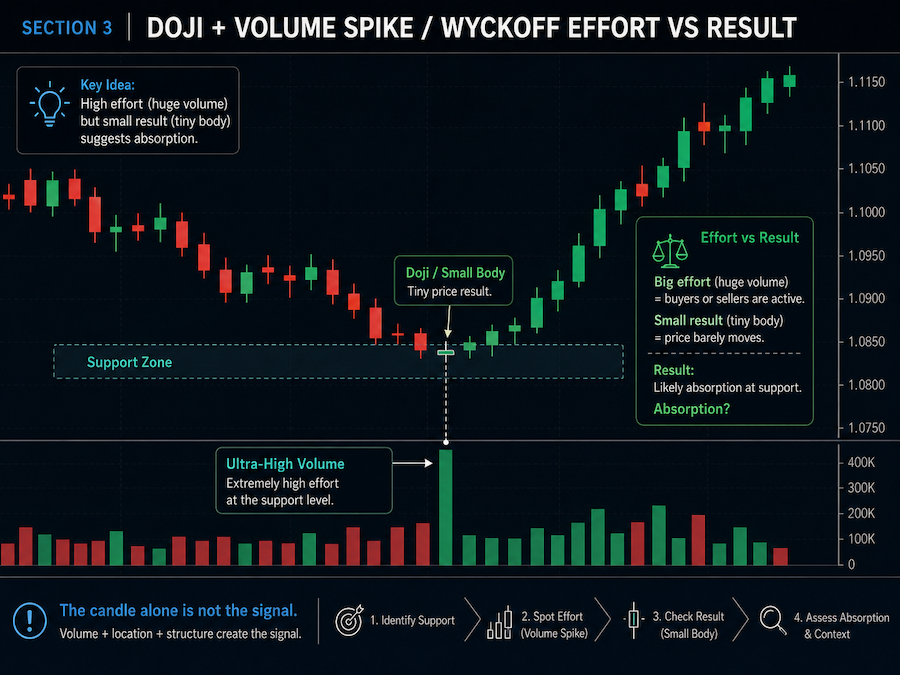
    Imagine a Doji candle forming at a key support level with extremely high volume.

    If volume represents effort, then high volume should normally produce a larger price movement. But if the candle body remains small despite massive volume, something unusual is happening.

    This is the anomaly.

    Large effort with little result may suggest absorption. Aggressive sellers may be hitting the market, but someone on the other side may be absorbing those orders without allowing price to move significantly lower.

    In Wyckoff terms, this is where the relationship between Effort and Result becomes critical.

    The candle itself is not the signal. The relationship between candle size, volume, location, and structure is the signal.

    Conclusion: Never Read a Candle in Isolation

    A candlestick only has meaning when it is read within market structure.

    Before trading any candle pattern, ask three questions:

    1. Did the wick sweep a meaningful liquidity pool?
    2. Did the body show displacement or acceptance?
    3. Does the volume confirm or contradict the price movement?

    A hammer is not automatically bullish.
    A shooting star is not automatically bearish.
    A doji is not automatically indecision.

    Candles are not signals by themselves.

    They are footprints.

    And once you learn to read those footprints through liquidity, volume, and structural intent, you stop trading textbook patterns and start reading the market like a process.

  • Live Briefing #002-The 1.272-1.618 Liquidity Code: The Bitcoin Pattern That Cost Traders Millions

    Retail traders love to believe that the market moves on news, tweets, or random chaos. But if you know how to read session liquidity, you quickly realize the market is governed by a highly precise, algorithmic design.

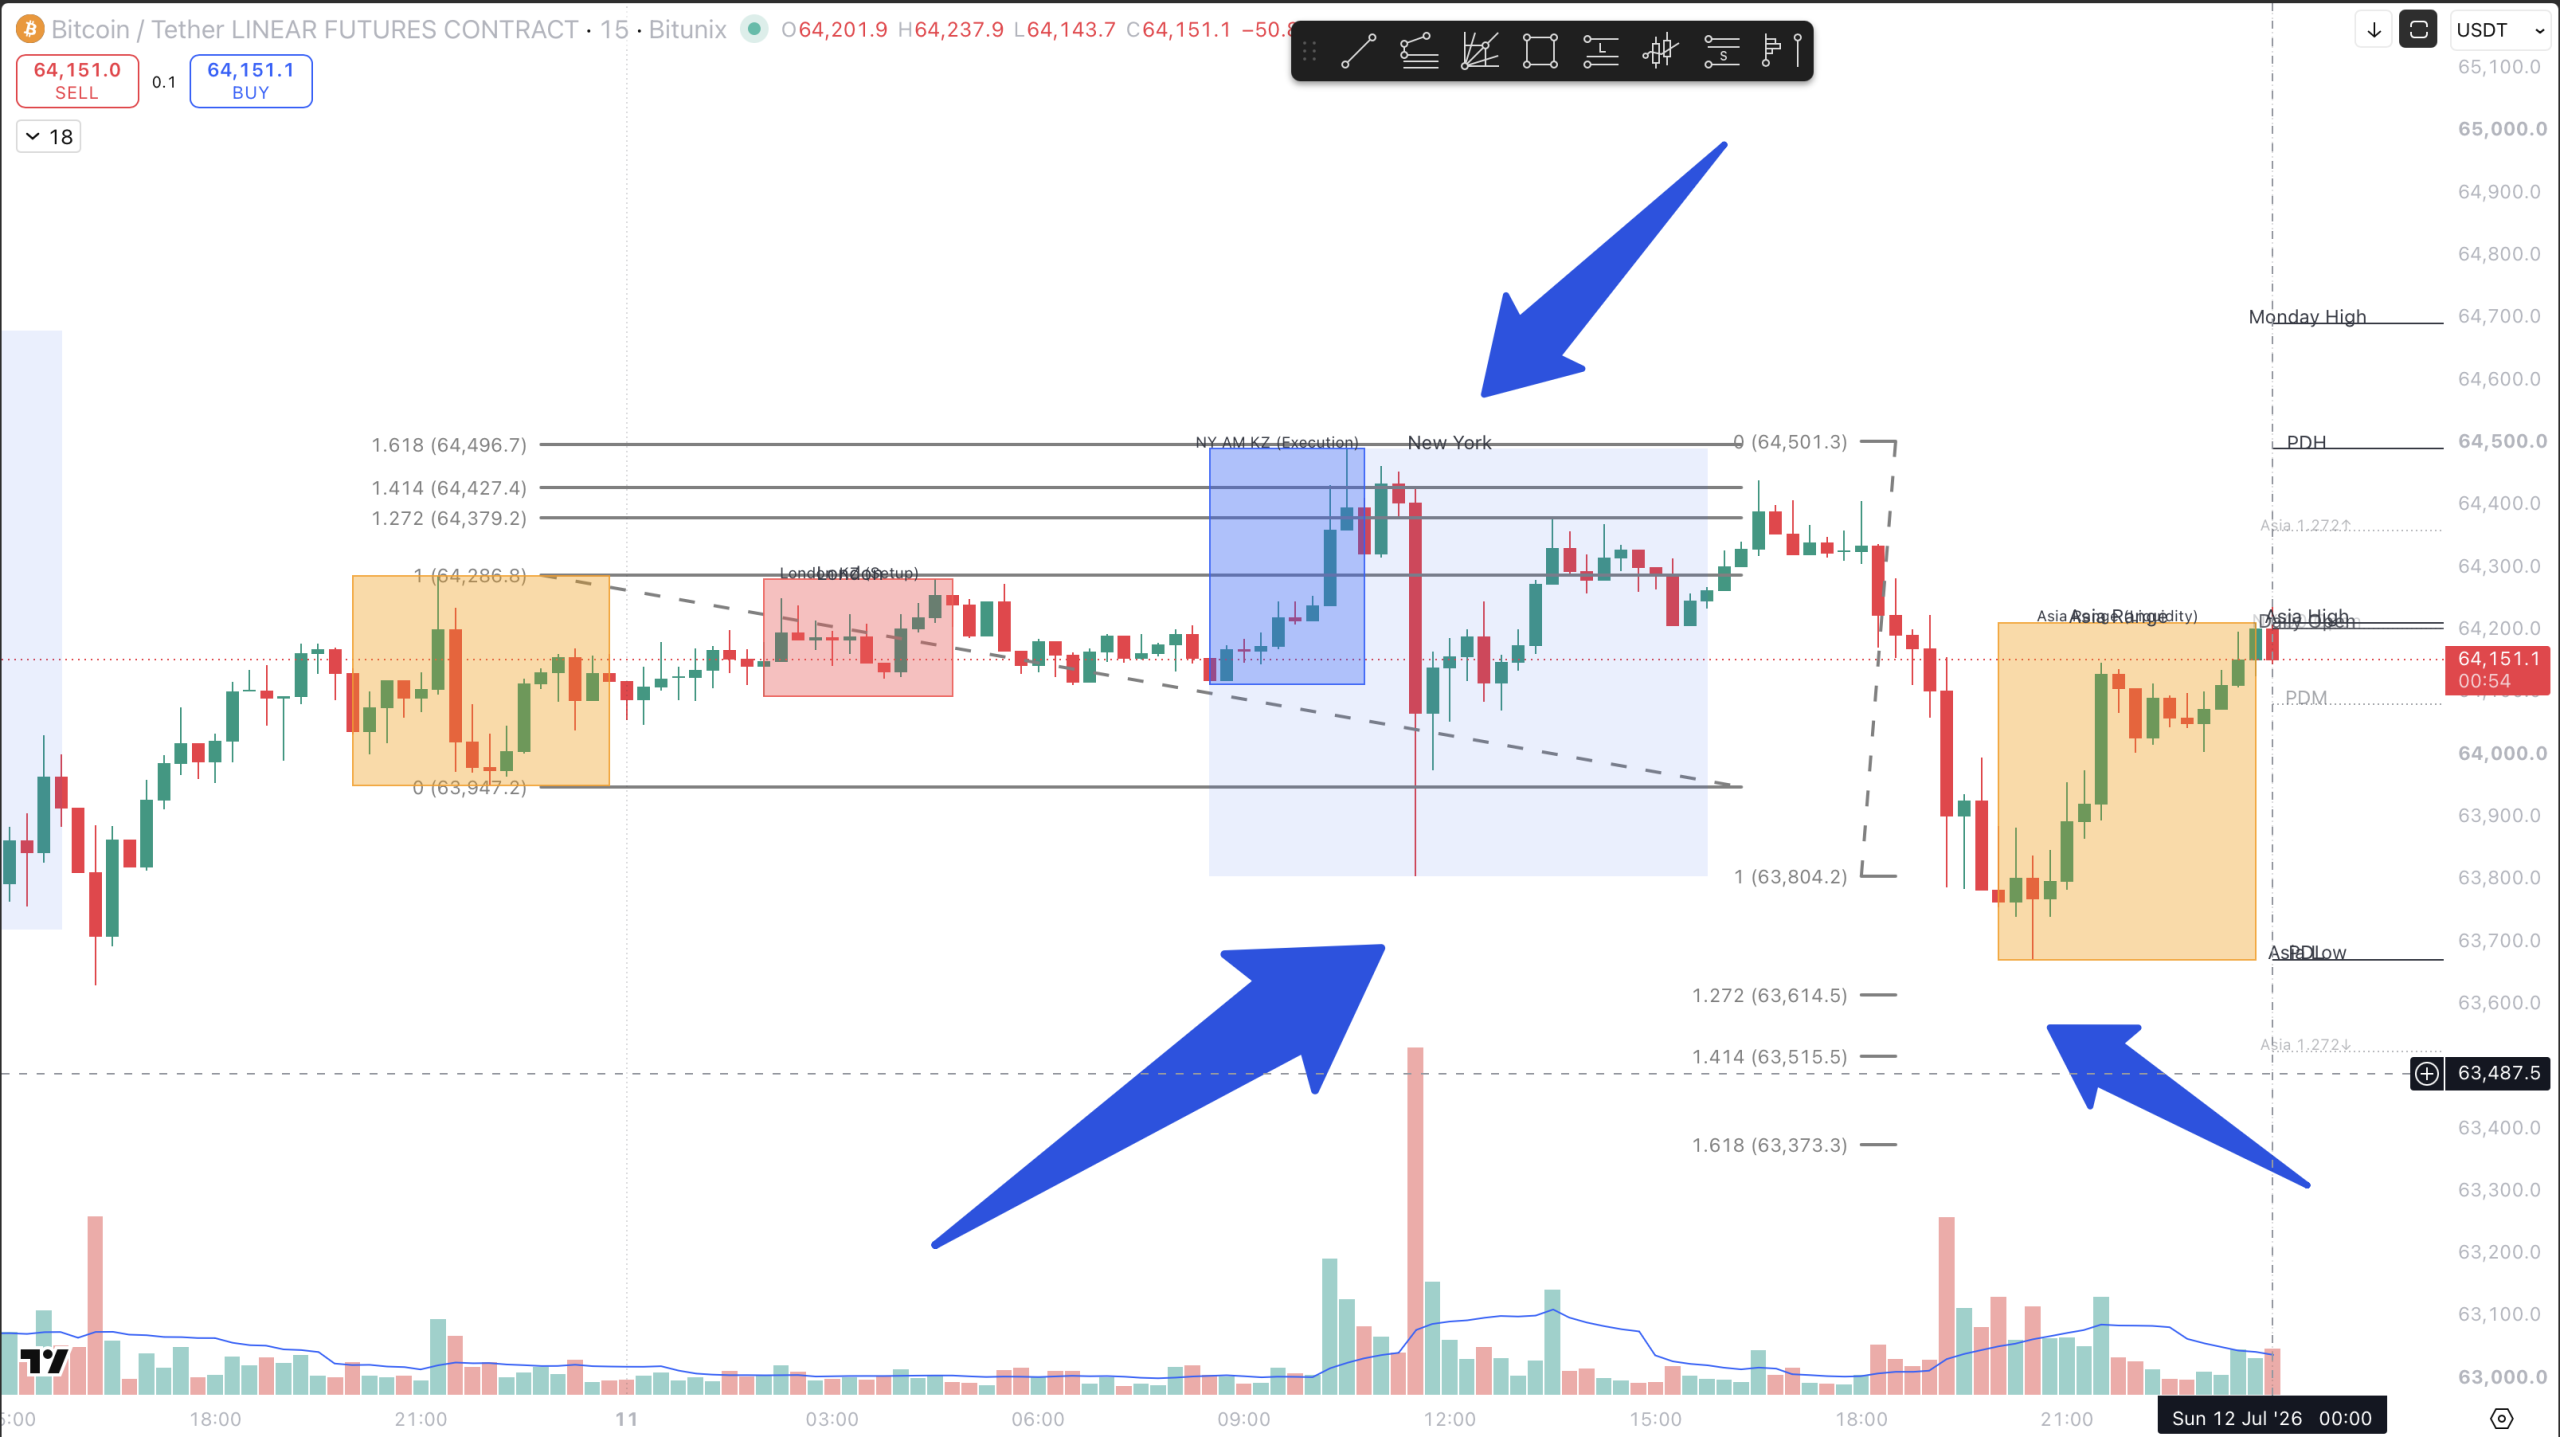
    Price does not move randomly; it moves strictly from one liquidity pool to another, using math to trap the maximum number of breakout traders. Let’s break down the mechanics using the recent 15-minute Bitcoin chart.

    Yesterday’s Script: The Asian Range 1.272 Double Trap

    To understand today’s live price action, we must analyze the perfect blueprint engineered yesterday. The algorithm utilized the Asian Session High and Low as its primary structural liquidity boundaries.

    1. The Upside Trap: During the New York session, the price aggressively broke above the Asian session high. To the untrained retail eye, this looked like a confirmed bullish breakout. However, the algorithm was simply expanding the range to the exact 1.618 Fibonacci Extension level to sweep the Buy-Side Liquidity (BSL). Once the stops were hunted, the price aggressively reversed downward.
    2. The Downside Trap: After collapsing back through the range, the price sliced below the Asian session low, triggering breakout shorts and hunting the stop-losses of late buyers. Again, notice where the decline halted: precisely at the 1.618 Fibonacci Extension level of the Asian range. A massive Sell-Side Liquidity (SSL) sweep occurred, followed by an immediate structural reversal back to the upside.

    Today’s Continuity: Hunting Yesterday’s New York Low

    The algorithm repeats the exact same code day after day. Today, the reference points shifted from the Asian range to Yesterday’s New York Session High and Low.

    Look closely at the current live price action. The market pushed downward, targeting the liquidity resting below yesterday’s NY low. Once again, it did not just stop anywhere—it dropped into the exact 1.272 extension zone of yesterday’s NY range, engineering a perfect liquidity sweep.

    As soon as the institutional orders filled by absorbing the retail panic-selling, the price immediately reversed and is now expanding back upward.

    The Core Law: Price Follows Liquidity

    This is the ultimate proof that price is simply an engineering tool designed to hunt liquidity. Breakout traders trading textbook chart patterns are the fuel for these movements.

    • The Breakout is the Trap: When a key level breaks, it is rarely a sign of continuation; it is usually an invitation for retail liquidity to enter the market so Smart Money can fill their opposing orders.
    • The 1.272-1.618 Zone is the Key: The 1.272 expansion is the mathematical sweet spot where algorithms frequently execute these stop-hunts before reversing the trend.

    Conclusion: Stop chasing the momentum after a breakout occurs. Map your session highs and lows, plot your 1.272-1.618 extension zones, and wait for the sweep confirmation. Let the algorithm trap the retail crowd first, and then trade alongside the Smart Money.