Category: Market Analysis

  • Live Briefing #003 – BTC When Harmonics Meet Liquidity Traps (The Bullish Butterfly)

    Indicators lag. News deceives. But structure is absolute.

    When retail traders capitulate on what they perceive as a “confirmed breakdown,” Smart Money is quietly executing massive accumulation phases. Today’s Bitcoin 4-hour (BTCUSD 4H) chart provides a textbook masterclass on how institutional liquidity engineering perfectly aligns with harmonic structures—a narrative completely invisible to traditional lagging indicators.

    The Trap: Liquidity Engineering & Institutional Intent

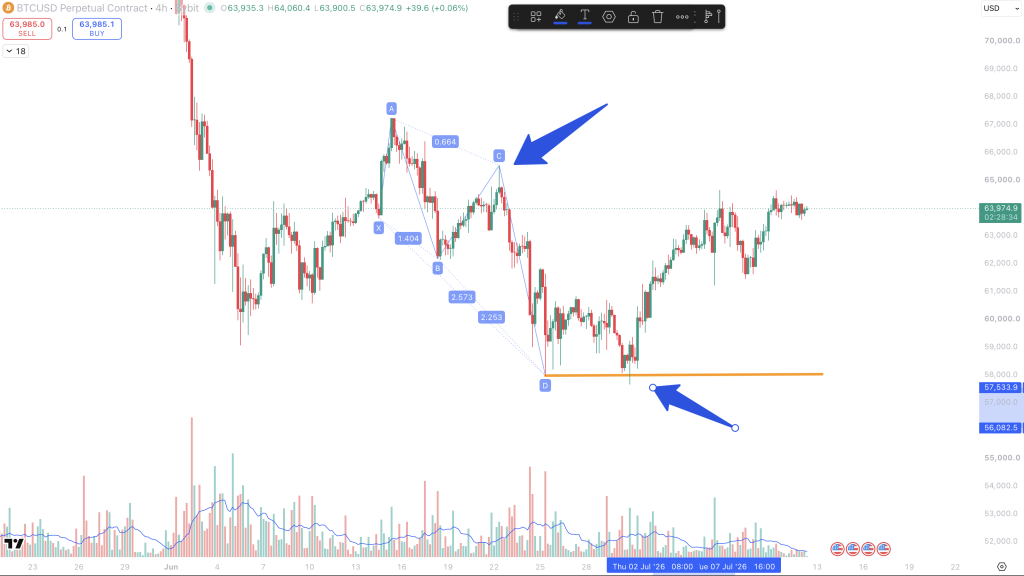
    Look closely at the deep deviation at the chart’s lower boundary. The retail consensus interpreted this downward thrust as a catastrophic structural failure. In reality, it was a highly engineered trap.

    Through an ICT (Inner Circle Trader) lens, this is a classic Turtle Soup—a deliberate sweep of previous lows. Within Wyckoff logic, it represents the ‘Spring’ phase of the accumulation cycle. Smart Money purposefully targeted the Sell-Side Liquidity (SSL) resting below the structural lows. They triggered a cascade of retail stop-losses, absorbing that exact liquidity to fuel their true upward expansion.

    Harmonic Confluence: Patterns Validated by Context

    This precise liquidity sweep did not occur in a random vacuum. The absolute low perfectly struck the 1.404 extension of the XA leg, fulfilling the exact parameters for the Potential Reversal Zone (PRZ) of a Bullish Butterfly (or Alternate Crab) pattern.

    Harmonic patterns are not magic lines drawn in isolation. They are highly sophisticated tools for identifying high-probability reversal zones within the larger structural context. Institutions utilized this specific PRZ to absorb the engineered retail panic and complete their pattern.
    Execution: Confirmation Over Assumption

    The core philosophy of StructFirst is that we never blindly predict the bottom; we demand structural confirmation. A mere V-shaped bounce from a PRZ does not instantly validate a trend reversal.

    True structural conviction was only established when the price forcefully breached the resistance neckline at point B, triggering a definitive Market Structure Break (MSB). This structural shift proved that the preceding drop was merely a Bear Trap, officially confirming the transition from accumulation into the Markup phase.

    What’s Next: Targeting the Next Liquidity Pool

    The market is a delivery algorithm that moves deliberately from one liquidity pool to another. Having swept the downside liquidity and successfully shifted the market structure bullish, Smart Money’s crosshairs are now aimed higher.

    Our upside targets are not arbitrary resistance lines drawn on a chart. The true magnetic draws are the untouched pools of Buy-Side Liquidity (BSL) resting above the structural highs of points C and A.

    If you are ready to stop chasing retail illusions and start reading the true intentions of the market, you are in the right place. Let’s decode the structure together.

    Welcome to StructFirst.
  • Live Briefing #002-The 1.272-1.618 Liquidity Code: The Bitcoin Pattern That Cost Traders Millions

    Retail traders love to believe that the market moves on news, tweets, or random chaos. But if you know how to read session liquidity, you quickly realize the market is governed by a highly precise, algorithmic design.

    Price does not move randomly; it moves strictly from one liquidity pool to another, using math to trap the maximum number of breakout traders. Let’s break down the mechanics using the recent 15-minute Bitcoin chart.

    Yesterday’s Script: The Asian Range 1.272 Double Trap

    To understand today’s live price action, we must analyze the perfect blueprint engineered yesterday. The algorithm utilized the Asian Session High and Low as its primary structural liquidity boundaries.

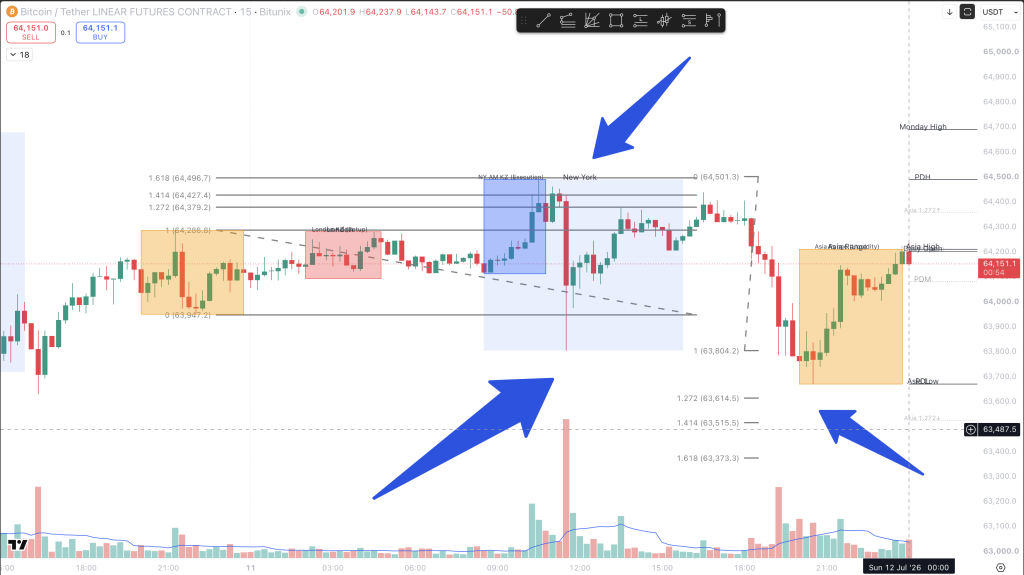
    1. The Upside Trap: During the New York session, the price aggressively broke above the Asian session high. To the untrained retail eye, this looked like a confirmed bullish breakout. However, the algorithm was simply expanding the range to the exact 1.618 Fibonacci Extension level to sweep the Buy-Side Liquidity (BSL). Once the stops were hunted, the price aggressively reversed downward.
    2. The Downside Trap: After collapsing back through the range, the price sliced below the Asian session low, triggering breakout shorts and hunting the stop-losses of late buyers. Again, notice where the decline halted: precisely at the 1.618 Fibonacci Extension level of the Asian range. A massive Sell-Side Liquidity (SSL) sweep occurred, followed by an immediate structural reversal back to the upside.

    Today’s Continuity: Hunting Yesterday’s New York Low

    The algorithm repeats the exact same code day after day. Today, the reference points shifted from the Asian range to Yesterday’s New York Session High and Low.

    Look closely at the current live price action. The market pushed downward, targeting the liquidity resting below yesterday’s NY low. Once again, it did not just stop anywhere—it dropped into the exact 1.272 extension zone of yesterday’s NY range, engineering a perfect liquidity sweep.

    As soon as the institutional orders filled by absorbing the retail panic-selling, the price immediately reversed and is now expanding back upward.

    The Core Law: Price Follows Liquidity

    This is the ultimate proof that price is simply an engineering tool designed to hunt liquidity. Breakout traders trading textbook chart patterns are the fuel for these movements.

    • The Breakout is the Trap: When a key level breaks, it is rarely a sign of continuation; it is usually an invitation for retail liquidity to enter the market so Smart Money can fill their opposing orders.
    • The 1.272-1.618 Zone is the Key: The 1.272 expansion is the mathematical sweet spot where algorithms frequently execute these stop-hunts before reversing the trend.

    Conclusion: Stop chasing the momentum after a breakout occurs. Map your session highs and lows, plot your 1.272-1.618 extension zones, and wait for the sweep confirmation. Let the algorithm trap the retail crowd first, and then trade alongside the Smart Money.

  • Live Briefing #001-BTC 4H Structure: The Heavy Resistance Block

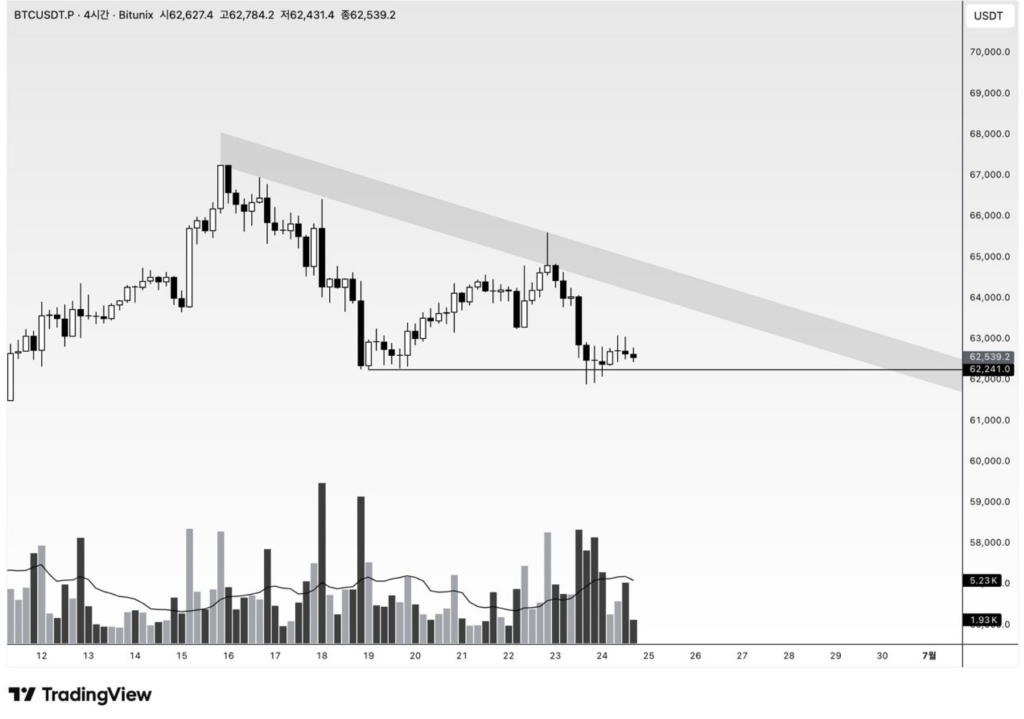
    In structural trading, identifying where the institutional supply rests is just as important as finding the setup itself. Currently, the Bitcoin 4-Hour (4H) chart presents a clear structural problem for buyers.

    BTC 4H Structure: Heavy Supply Zone capping the upside movement.


    Looking at the current price action, we can clearly define the upper and lower boundaries. However, the most critical element here is the sheer thickness of the upper resistance line (Supply Block).

    • The Structural Problem: The market is compressing against a massive, heavy supply zone. Breaking through this level requires significant institutional intent (Displacement) and aggressive market buying, which is currently absent.
    • Current State: It is highly improbable for retail volume alone to slice through this thick resistance. We are seeing rejection wicks confirming the strong presence of sellers actively defending this zone.

    HTF Context: Why is this Resistance so Heavy?


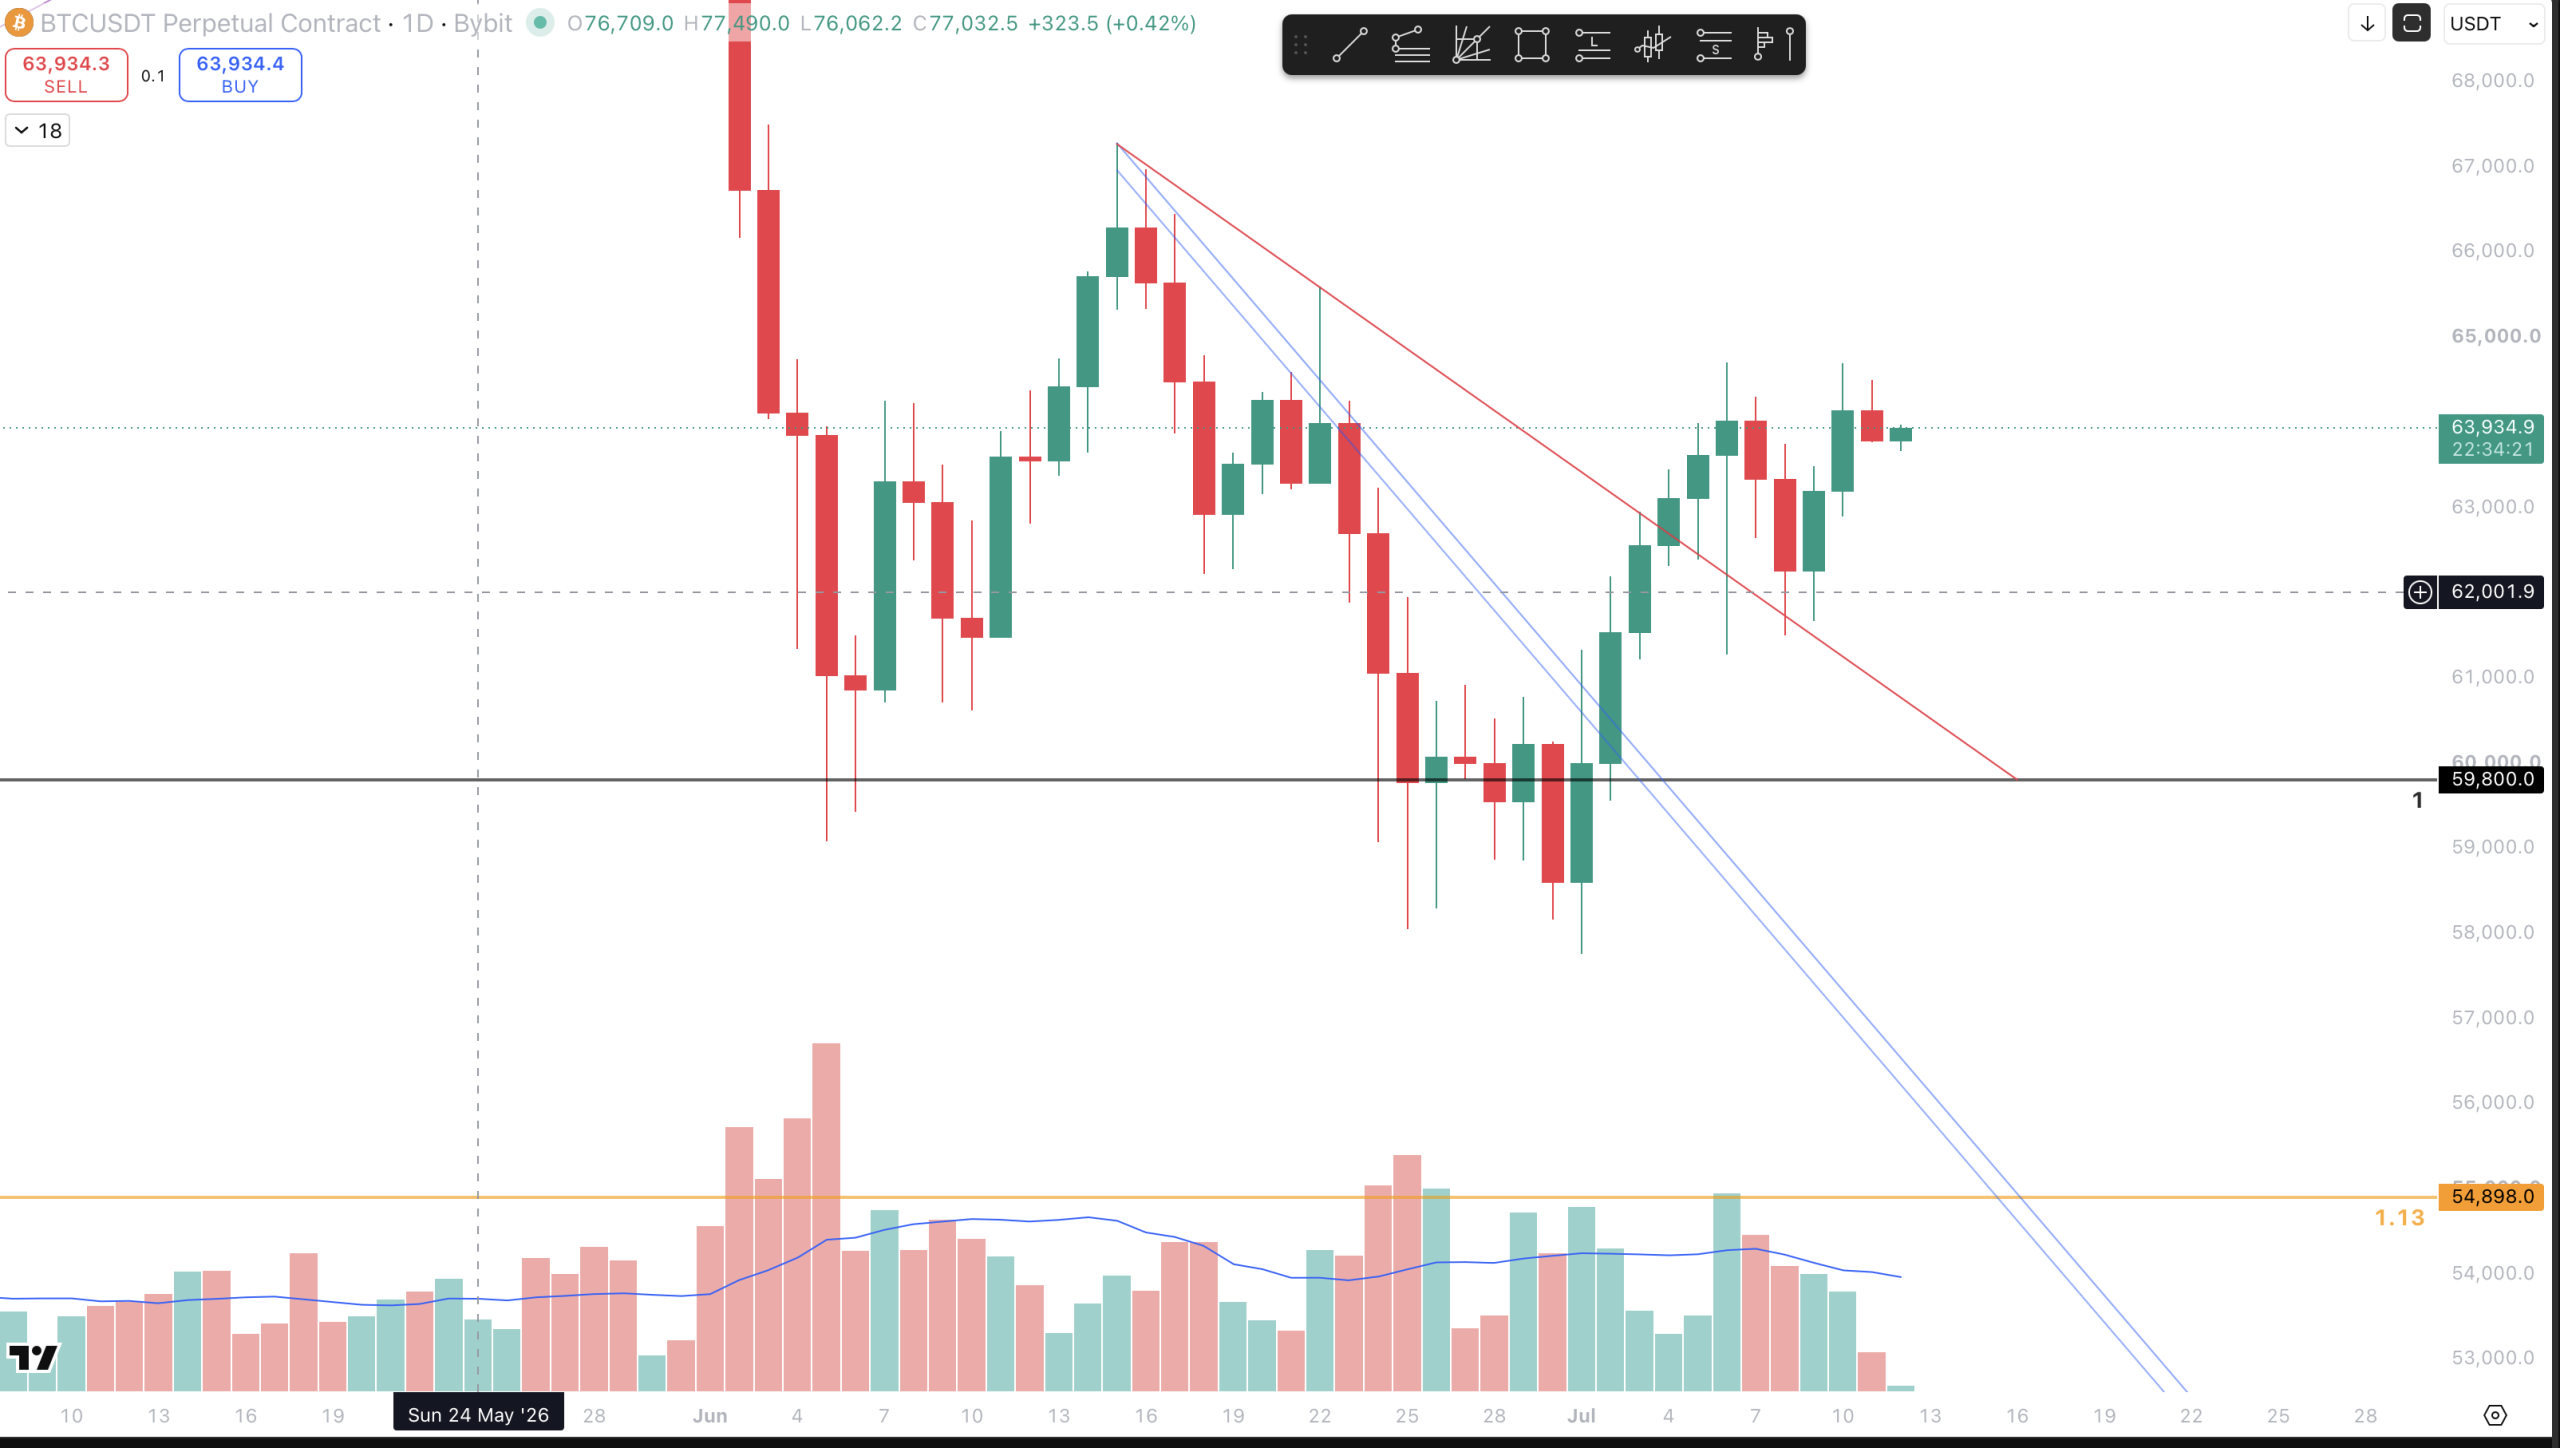
    Top-Down View: The 4H resistance aligns with critical HTF supply.

    We do not look at the 4H timeframe in isolation. If we zoom out to the Daily (D1) structure, this 4H resistance block perfectly aligns with a Higher Timeframe (HTF) distribution zone. There are trapped long positions from previous weeks actively looking to break even, creating a massive wall of sell limit orders. This is why the overhead supply is dynamically thick.

    Liquidity Positioning & Target Map

    Markets move from one liquidity pool to another. If the Smart Money intent is not to break this upper resistance, they will distribute current holdings and target the liquidity resting below.

    • Buy-Side Liquidity (BSL): Resting above the thick gray box. Untapped, but highly protected by sellers.
    • Sell-Side Liquidity (SSL): Look at the recent swing lows formed during this consolidation. Retail traders are placing their stop-losses just below these obvious support lines. If the upper resistance holds, this SSL is the primary magnetic target for the algorithmic delivery.

    Execution Plan & Scenarios

    We do not predict the direction; we react to the structure. Here is the operational plan for the session:

    • Primary Scenario (Rejection): Price sweeps the local highs into the supply box but closes back inside the range (Failure to displace). Execution: Look for short setups targeting the SSL resting at the local lows.
    • Secondary Scenario / Invalidation: A full-bodied 4H candle close above the thick resistance block, completely clearing the supply. This invalidates the bearish bias. We then wait for a structural retest to flip resistance into support before looking for longs.
    • No-Trade Condition: Trading the middle of this chop is a gamble. If the price remains compressed between the supply box and the immediate local support without sweeping either side, we sit on our hands. Capital preservation is the priority.

    Conclusion: Do not anticipate the breakout. Wait for the confirmation. Until this resistance is structurally broken and retested as support, the path of least resistance remains sideways or downward.