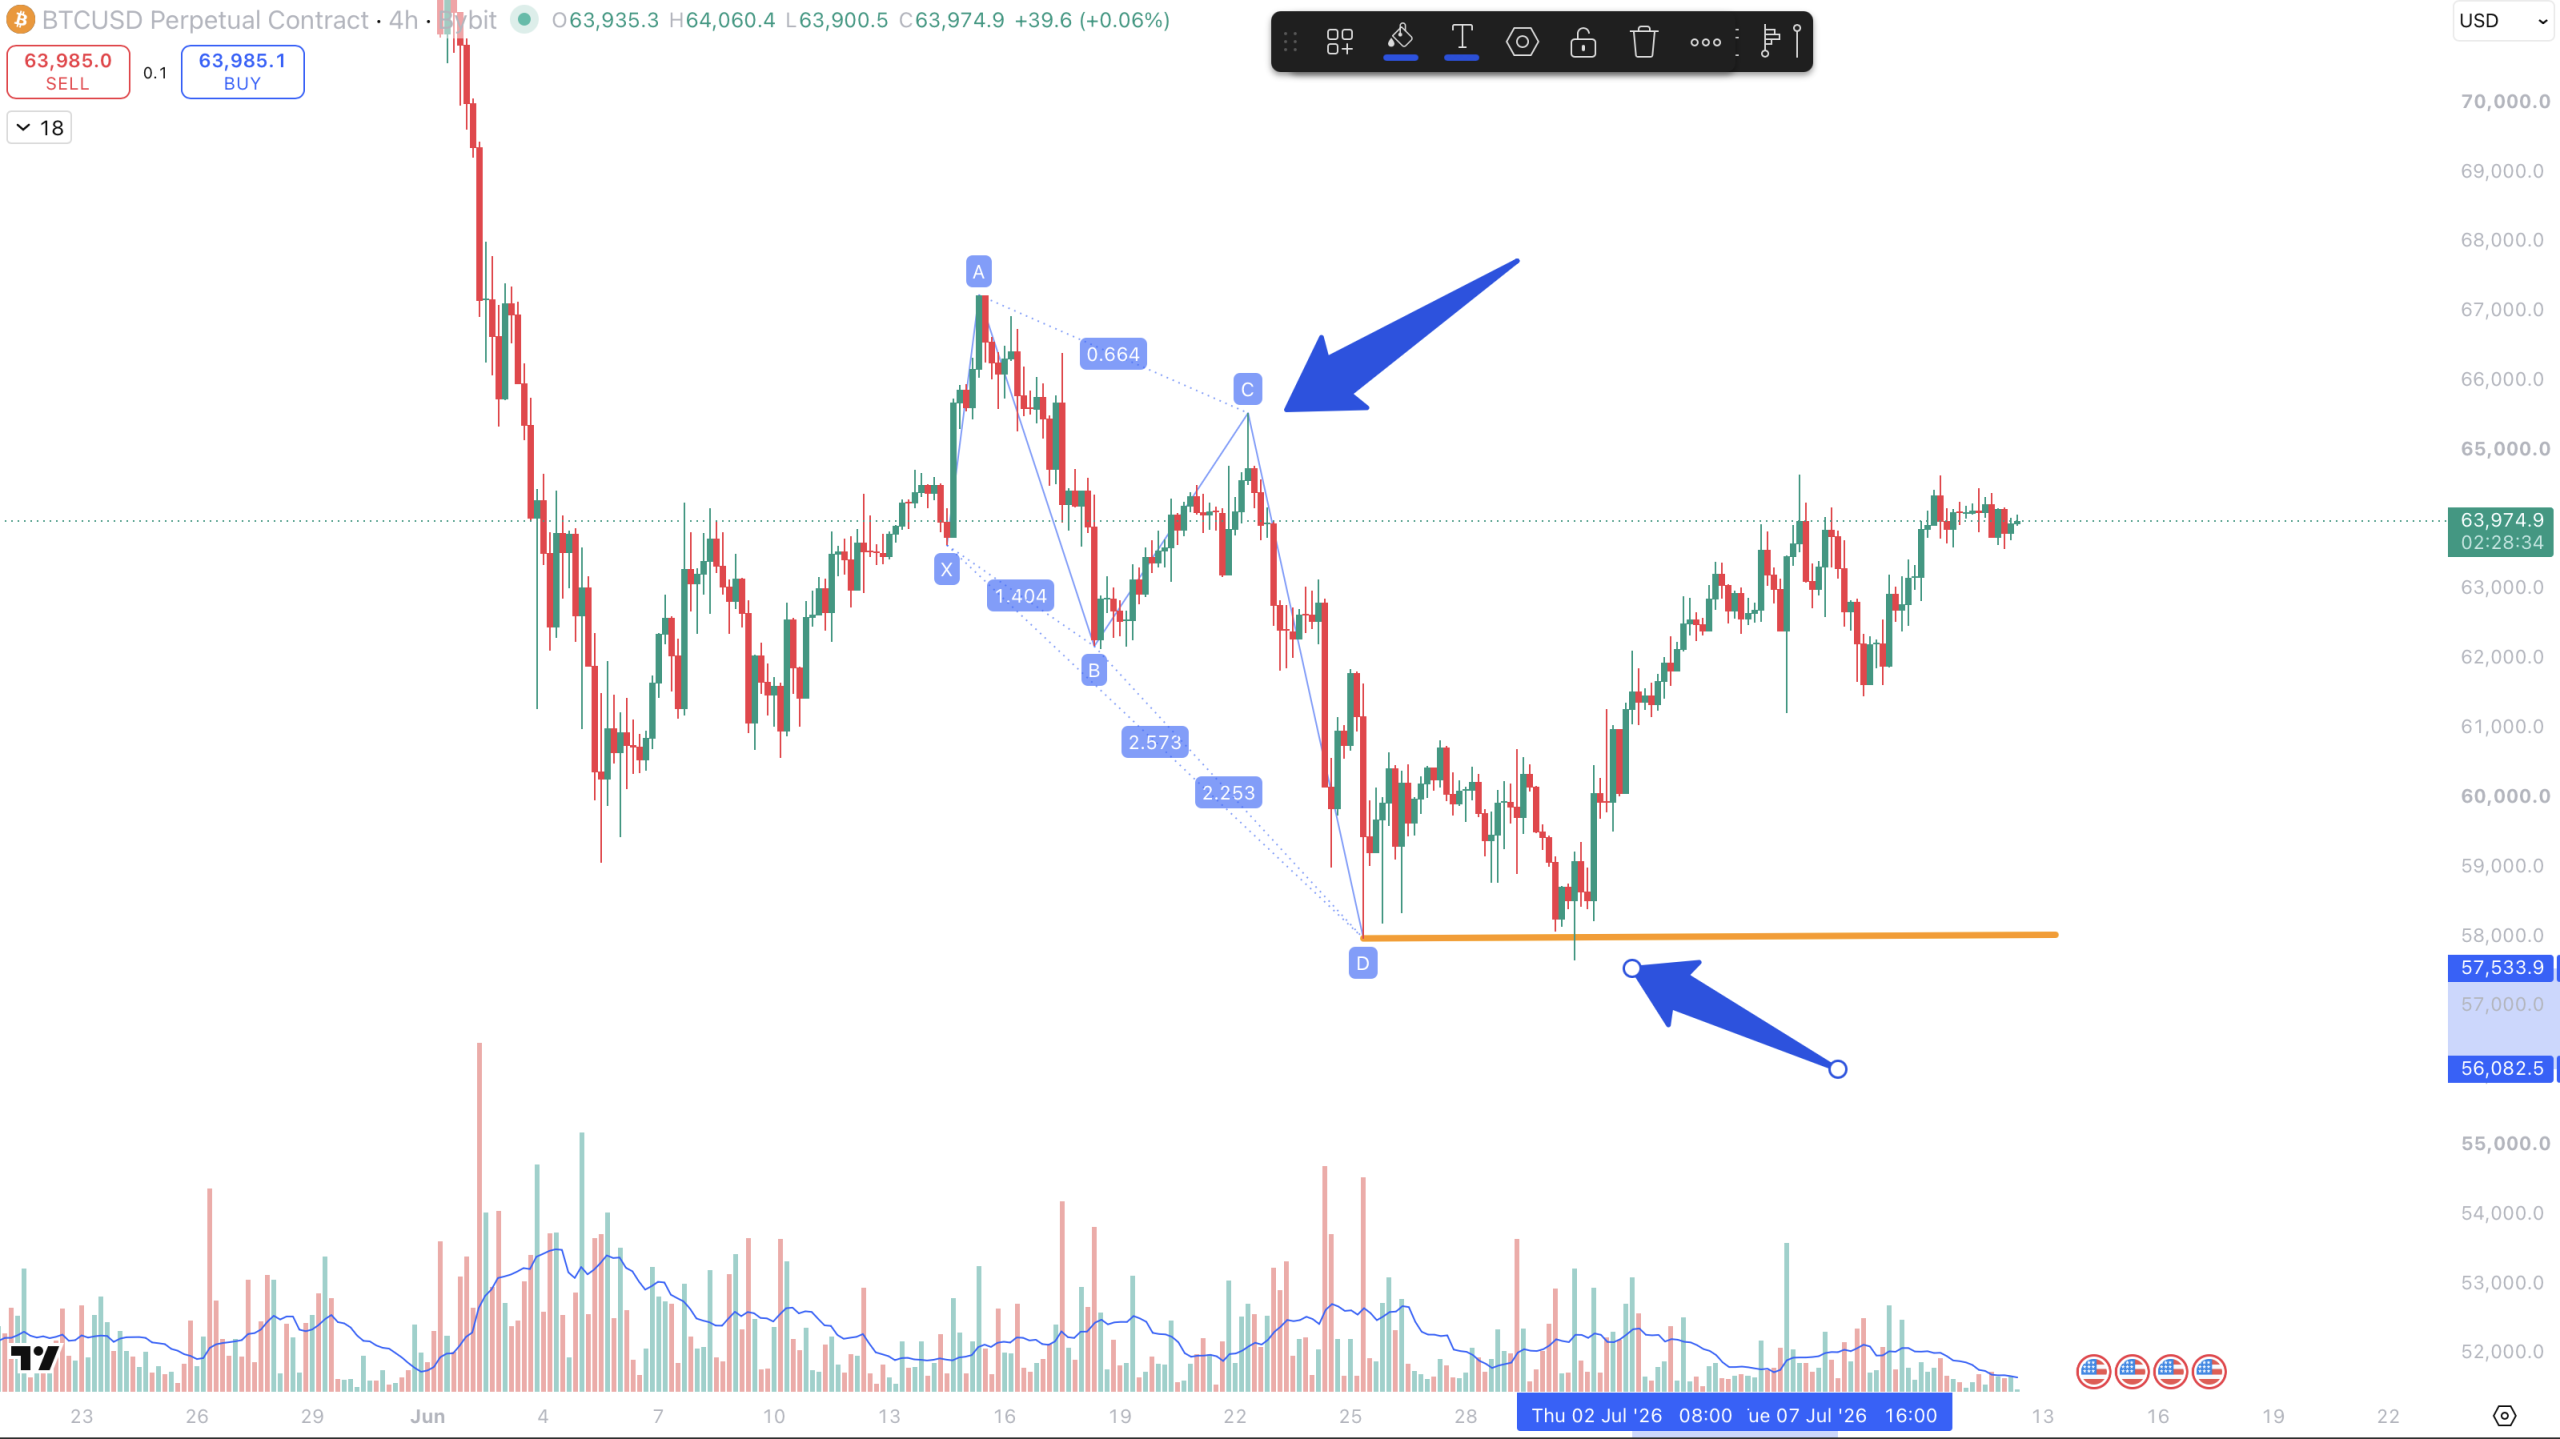
Historical Structural Review | BTCUSD Perpetual | 4H | Bybit
The original briefing interpreted the decline into the harmonic completion zone as confirmed institutional accumulation.
The chart could not verify that conclusion.
What it did confirm was more useful: price reached a defined lower liquidity area, reacted from a bullish harmonic Potential Reversal Zone, and recovered through part of the preceding bearish structure.
The harmonic geometry identified a location. The liquidity event created interest. The subsequent structural response determined whether that location became actionable.
This is a historical case study, not a current Bitcoin trade signal.
Market Status
| Component | Structural Reading |
|---|---|
| Bias | Conditional bullish reaction |
| HTF Structure | Recovery after a major bearish decline |
| Liquidity | Sell-side liquidity around D was accessed |
| Harmonic Context | Bullish Butterfly or alternate bullish harmonic candidate |
| Confirmation | Internal recovery visible; external reversal incomplete |
| Invalidation | Sustained 4H acceptance below D |
| Target Liquidity | C-point region and protected highs above it |
| Trade Status | Historical review only |
1. Key Structural Problem
The central question was not whether the harmonic drawing looked precise.
It was whether the reaction from D changed enough structure to justify a bullish thesis.
A harmonic PRZ identifies an area where a reaction may develop. A liquidity sweep confirms that orders below a prior low were accessed. Neither event independently confirms a reversal.
The sequence required was:
PRZ Location
→ Sell-Side Liquidity Event
→ Reclaim
→ Bullish Displacement
→ Relevant Structure Break
→ Acceptance
This distinction is central to What Is a Liquidity Sweep? Confirmation, Failure, and Execution.
2. HTF Structure
The four-hour chart developed after a significant markdown. Price formed an X-A-B-C structure before declining toward the projected D-point.
The recovery from D was meaningful, but the higher-timeframe bearish structure was not automatically reversed.
Price still needed to recover the controlling lower highs and establish acceptance above the C-point region.
The correct reading was therefore:
A bullish reaction developed from a lower structural location, but external trend reversal remained unconfirmed.
A local bullish recovery can occur without changing the swing that controls the broader trend. That hierarchy is explained in Internal vs External Market Structure: Which Swing Actually Controls the Trend?.
3. Liquidity Positioning
The projected D-point overlapped the lower boundary of the visible structure and a likely sell-side liquidity area.
Price reached that zone and failed to continue expanding lower.
Confirmed Observation:
Price accessed the lower liquidity area and reacted upward.
Structural Inference:
Responsive demand gained temporary control after the liquidity event.
Unconfirmed Possibility:
The event may have developed as part of accumulation or a Wyckoff Spring process.
A trade below support is not automatically a Spring. Price must reject lower value, reclaim the range, and demonstrate subsequent strength.
4. Wyckoff / ICT Context
From an ICT perspective, the D-point represented a sell-side liquidity event followed by a possible bullish repricing sequence.
From a Wyckoff perspective, the low could be classified only as a Spring candidate. A stronger interpretation would require a successful reclaim, a test, and a clearer Sign of Strength.
Neither framework should be forced from the wick alone.
The relevant evidence was the market’s behavior after the low:
- Did price reclaim the lower boundary?
- Did bullish displacement follow?
- Was a meaningful lower high broken?
- Did price remain accepted above the reclaimed structure?
5. Harmonic / PRZ Check
The chart displays an X-A-B-C-D harmonic structure developing after the broader bearish decline.
The measured ratios placed D inside a potential bullish reaction area. The formation may resemble a Bullish Butterfly or an alternate bullish harmonic structure, but the exact label was less important than the structural location.
The geometry defined where a reaction could occur.
It did not confirm that the bearish auction had ended.
The BTCUSD Perpetual four-hour chart shows price declining from C into the projected D-point near the lower liquidity boundary. Trading activity increased around the low, after which price moved sharply away from the zone.
The reaction confirmed that the lower area attracted responsive buying. It did not prove who initiated the buying or that a completed accumulation phase had formed.
Price subsequently recovered through several internal highs, indicating that the prior bearish delivery had weakened. However, sustained acceptance above C and the larger protected highs was still required before classifying the movement as a confirmed higher-timeframe reversal.
The chart therefore supported a conditional bullish reaction rather than a completed trend change.
6. Intent
Institutional intent cannot be directly observed from a chart.
It must be inferred from price behavior.
Bullish intent was suggested by the market’s ability to reject D, reclaim lower structure, and continue delivering higher rather than accepting below the range.
A stronger bullish intent sequence would be:
Sell-Side Liquidity
→ Reclaim
→ Bullish Displacement
→ Lower-High Break
→ Retest Hold
The role of real displacement, as opposed to candle size alone, is developed in What Is Displacement in Trading? Why Strong Candles Alone Are Not Enough.
7. Confirmation
The reaction from D provided early bullish evidence:
- price moved decisively away from the low;
- the recovery continued beyond one isolated candle;
- several internal resistance points were recovered;
- bearish momentum weakened.
However, an internal CHoCH would only show that the local bearish sequence had been challenged.
A stronger Market Structure Shift required displacement through a meaningful protected swing and acceptance beyond it.
The differences between these events are explained in BOS vs CHoCH vs Market Structure Shift: What Actually Confirms a Trend Change?.
8. Invalidation
The bullish thesis weakened if price returned to D and failed to produce another meaningful response.
It failed more clearly if four-hour candles established sustained acceptance below the lower liquidity zone.
A brief wick below D was not necessarily enough.
Invalidation required evidence that the market was accepting lower prices rather than simply accessing liquidity beneath the low.
9. Execution Condition
The harmonic PRZ itself was not the entry.
A conditional long execution required:
- rejection or reclaim from D;
- bullish displacement;
- a break of a relevant lower high;
- preservation of the displacement origin during a retest;
- sufficient distance to the next buy-side liquidity objective.
A Fair Value Gap formed during the bullish displacement could help identify a retracement area, but it would remain a location rather than an automatic order level. See How to Read a Fair Value Gap in Market Structure.
10. MDA D1–D10 Verification
D1–D3: The higher-timeframe decline, sell-side liquidity, and harmonic PRZ were visible.
D4–D5: Bullish intent remained an inference, while displacement away from D was observable.
D6–D7: Internal structure improved and price remained above the low.
D8: A precise execution retest was not fully visible in the supplied chart.
D9: Acceptance below D would invalidate the bullish thesis.
D10: No trade was justified without confirmation and predefined risk.
11. Primary Scenario
The primary bullish scenario required price to preserve D, continue recovering internal structure, and eventually break the C-point region with displacement.
Acceptance above C would strengthen the argument that the D-point marked more than a temporary corrective reaction.
12. Secondary Scenario
The secondary scenario was a corrective rally inside a still-bearish higher-timeframe structure.
Price could react strongly from D, rebalance part of the decline, fail below C, and rotate back toward lower liquidity.
The initial reaction alone could not eliminate this possibility.
13. Target Liquidity
The first objective was the nearest internal buy-side liquidity created during the decline.
The next objective was the C-point region and the protected lower highs above it.
Only sustained acceptance beyond those levels would expose the larger A-point liquidity.
Targets had to follow structural liquidity rather than arbitrary percentages.
14. Risk Assessment
The setup offered strong location confluence but incomplete higher-timeframe confirmation.
The principal risks were:
- entering directly at D without confirmation;
- treating the harmonic ratio as a reversal guarantee;
- classifying a liquidity sweep as confirmed accumulation;
- confusing internal recovery with external reversal;
- targeting A before C was reclaimed;
- placing invalidation only a few ticks below the PRZ rather than beyond the structural failure point.
15. No-Trade Conditions
No trade was justified when:
- D produced no bullish displacement;
- the lower boundary was not reclaimed;
- internal structure remained unclear;
- invalidation was too wide relative to target liquidity;
- price had already extended too far from the origin;
- C was too close to provide acceptable reward;
- or the bullish argument depended only on the harmonic label.
No-trade remained the professional decision until location, response, structure, and risk aligned.
Expand Your Structural Edge
The harmonic pattern identified a possible reaction location.
The sell-side liquidity event created the test.
The response from D suggested that bearish control had weakened.
Displacement and structural acceptance determined whether that reaction became executable.
A harmonic PRZ should never be traded as a prediction by itself.
The more complete decision process is:
HTF Structure
→ Liquidity
→ Harmonic Location
→ Intent
→ Confirmation
→ Invalidation
→ Execution
→ Target Liquidity
Begin with Why Market Structure Comes First: The StructFirst Trading Framework to place harmonic analysis inside the complete StructFirst methodology.
Track the live order flow and volume footprint yourself directly on TradingView.
Leave a Reply