Most traders learn how to read candlesticks by memorizing pattern names.
A long lower wick becomes a hammer. A long upper wick becomes a shooting star. A large body becomes momentum. A small body becomes indecision.
These descriptions are not necessarily wrong. They are incomplete.
The same hammer-shaped candle can form after sweeping a major higher-timeframe low, in the middle of an unresolved range, beneath major resistance, or during strong bearish continuation. Its shape may be identical, but its structural meaning can be completely different.
To read candlesticks effectively, traders must move beyond isolated patterns and evaluate each candle within:
- Higher-timeframe market structure
- Liquidity positioning
- Candle-body acceptance
- Volume and participation
- Displacement
- Confirmation
- Invalidation
- Target liquidity
Candles do not predict direction by themselves.
They record where price traded, where it closed, how much effort accompanied the movement, and whether the market accepted or rejected the new price area.
This is why StructFirst reads candles as footprints rather than standalone trading signals.
For the broader analytical process, begin with Why Market Structure Comes First: The StructFirst Trading Framework.
Candles Are Footprints, Not Trading Signals
A candlestick records four basic values:
- Open
- High
- Low
- Close
Those values create the candle body and its upper and lower wicks.
The wick shows where price traveled during the period. The body shows where the period opened and closed. Volume shows how much activity occurred during that movement.
None of those components independently explains intent.
A long lower wick may represent:
- Sell-side liquidity being accessed
- Stop-loss execution below a prior low
- Temporary absorption
- A volatility event
- A failed breakdown
- A brief pause before continued selling
A large bullish body may represent:
- Strong demand
- Short covering
- Thin liquidity
- Repricing through resistance
- A temporary expansion that later fails
The candle becomes useful only after the trader asks four questions:
- Where did the candle form?
- What liquidity did it interact with?
- Did price establish acceptance or rejection?
- What would invalidate the interpretation?
Without those questions, candlestick analysis becomes pattern recognition without execution logic.
Why Market Structure Comes Before Candlestick Analysis
The first step in learning how to read candlesticks is identifying the controlling market structure.
A five-minute bullish engulfing candle may produce a short-term bounce while the Daily structure remains bearish. A strong breakout candle can still fail when it moves directly into higher-timeframe supply. A long lower wick can appear constructive but remain irrelevant if it forms in the middle of a range.
Before interpreting any candle, determine:
- Is the market trending, ranging, or structurally unresolved?
- Which timeframe controls the trade?
- Is price near internal or external liquidity?
- Is the candle forming in premium, discount, or equilibrium?
- Is it testing meaningful support, resistance, supply, or demand?
- Does the next target justify the structural invalidation?
Higher timeframes define the environment.
Lower timeframes refine the execution.
A lower-timeframe candle may confirm an intraday trade without confirming a Daily or Weekly trend reversal.
The candle should support the structural thesis. It should not create a directional opinion that the larger structure contradicts.
What Does a Candlestick Wick Really Mean?
A candlestick wick shows that price traded beyond the candle body before returning prior to the close.
Many traders immediately describe this as rejection.
A wick may indicate rejection, but it can also represent:
- Liquidity access
- Stop execution
- Breakout participation
- Absorption
- Volatility expansion
- A temporary probe
- Failed continuation
- The beginning of acceptance beyond the level
The wick confirms only that price visited the area and moved away before the candle closed.
It does not confirm why price moved there or whether the reaction will continue.
Lower Wicks and Sell-Side Liquidity
A lower wick becomes structurally important when it trades beneath a visible low containing sell-side liquidity.
That liquidity may include:
- Stops from existing long positions
- Sell-stop entries from breakdown traders
- Leveraged liquidations
- Orders beneath an equal-low structure
- Liquidity below a session or prior-day low
When price moves beneath the low, those orders become active. The resulting transaction flow may provide counterparties for participants seeking to buy.
This does not mean every lower wick proves accumulation.
Price can sweep a low, form a temporary reaction, and continue lower.
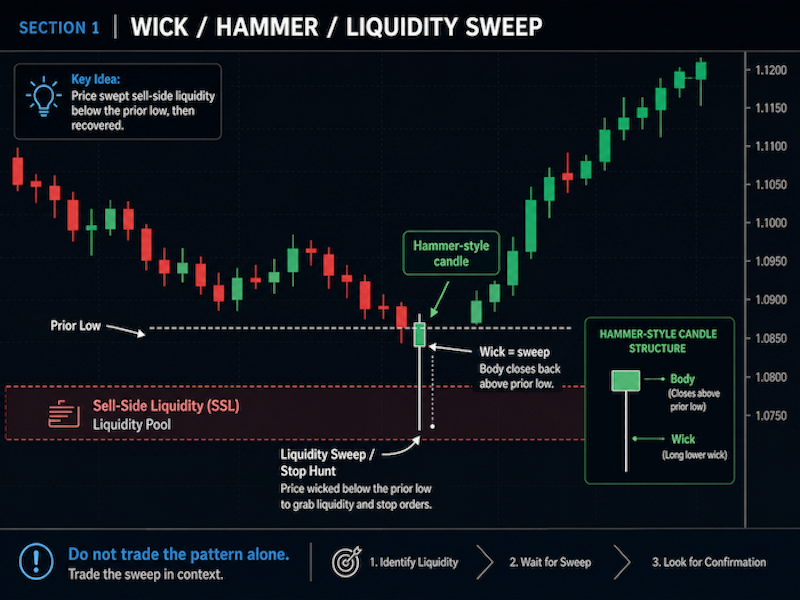
A bullish lower-wick interpretation becomes more credible when:
- The wick accesses meaningful external liquidity
- The candle closes back above the swept level
- Bullish displacement follows
- A meaningful lower-timeframe high is broken
- The reclaimed level holds during a retest
- Price fails to return beneath the sweep low
The wick identifies the event.
The subsequent price sequence confirms or rejects the thesis.
For a complete explanation of the possible outcomes after a sweep, read What Is a Liquidity Sweep? Confirmation, Failure, and Execution.
Upper Wicks and Buy-Side Liquidity
An upper wick may form when price trades above a visible high and returns beneath it.
This can indicate that:
- Buy-side liquidity was accessed
- Short stops were triggered
- Breakout buyers entered
- Supply responded at higher prices
- Price failed to establish immediate acceptance
It still does not automatically confirm a bearish reversal.
A bearish interpretation requires evidence such as:
- A close back beneath the swept high
- Bearish displacement
- Failure to reclaim the upper boundary
- A break of meaningful lower-timeframe support
- A weak retest
- Continued acceptance beneath the failed breakout
If price later reclaims the wick high, holds above it, and converts former resistance into support, the rejection thesis has failed.
A wick can become a liquidity trap. It can also become the first step in a successful breakout.
A wick alone does not confirm rejection, just as a body close alone does not confirm lasting acceptance. The market must show whether price can remain beyond the level, reclaim it, or fail during subsequent trading. For the complete framework, read What Are Acceptance and Rejection in Trading? Why One Wick or Close Is Not Enough.
How Candle Bodies Show Displacement and Acceptance
The candle body shows where the period opened and closed.
A large body indicates that price traveled a meaningful distance and retained much of that movement into the close.
Within market structure, this may provide evidence of displacement.
Displacement is not simply a large candle.
It is decisive repricing away from a meaningful structural location.
Useful displacement often includes:
- A strong body
- Limited opposing wick
- A break of relevant structure
- Volume or participation expansion
- An imbalance or Fair Value Gap
- Continued acceptance after the candle closes
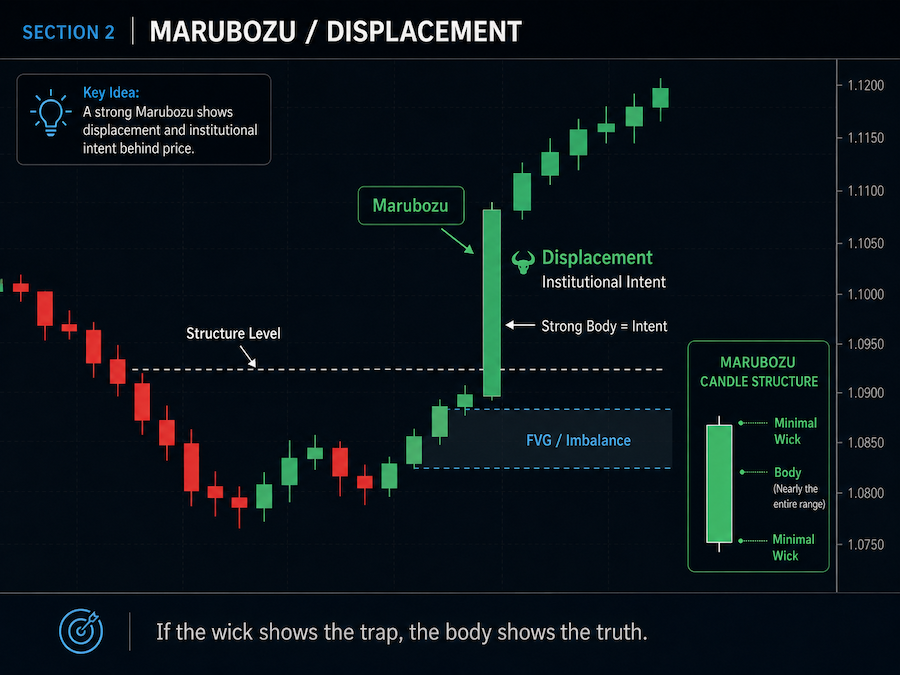
A Marubozu-style candle may show strong control during one period. It does not guarantee continuation.
The candles that follow must answer:
- Does price remain beyond the broken level?
- Does the market build value above or below the boundary?
- Does the retracement hold?
- Is the displacement origin protected?
- Does price continue toward the next liquidity target?
A large candle body can support a displacement thesis, but size alone is insufficient. Structural location, the swing that was broken, follow-through, and continued acceptance determine whether genuine repricing occurred. For the complete framework, read What Is Displacement in Trading? Why Strong Candles Alone Are Not Enough.
Wick Break vs Candle-Body Break
A wick through resistance confirms that price traded above the level.
A body close above resistance provides stronger evidence that higher prices were accepted during that candle.
Even a body close remains incomplete without follow-through.
A confirmed breakout sequence may include:
- A decisive body close beyond resistance
- Continued trading above the boundary
- A controlled retest
- Former resistance holding as support
- Expansion toward the next buy-side liquidity pool
A failed breakout sequence may include:
- Price trades or closes above resistance
- Follow-through weakens
- Price returns inside the prior range
- Bearish displacement develops
- The breakout fails during a retest
The featured image at the top of this guide illustrates why a wick break and body break should not be interpreted identically.
This same acceptance-versus-rejection logic is applied in Bitcoin 4H Resistance Zone: Liquidity, Confirmation, and Invalidation.
How Volume Changes the Meaning of a Candlestick
Volume measures activity.
It does not independently reveal which side gained control.
Wyckoff analysis compares Effort with Result:
- Volume represents effort.
- Price progress represents result.
This relationship helps traders interpret candles more effectively.
High Volume and Large Price Progress
High volume combined with strong displacement may support the view that price is being repriced aggressively.
The interpretation becomes stronger when the candle:
- Breaks meaningful structure
- Closes near its extreme
- Receives follow-through
- Holds the broken level
- Continues toward external liquidity
High Volume and Limited Price Progress
High volume with a small candle body may indicate that aggressive orders are being absorbed.
For example, heavy selling may enter at support while price makes little additional downward progress. This can suggest that opposing buyers are absorbing the available supply.
It can also represent:
- Two-sided conflict
- Position transfer
- Churn
- Temporary balance
- Exhaustion
- Early accumulation or distribution
The candle and volume spike cannot determine which interpretation is correct by themselves.
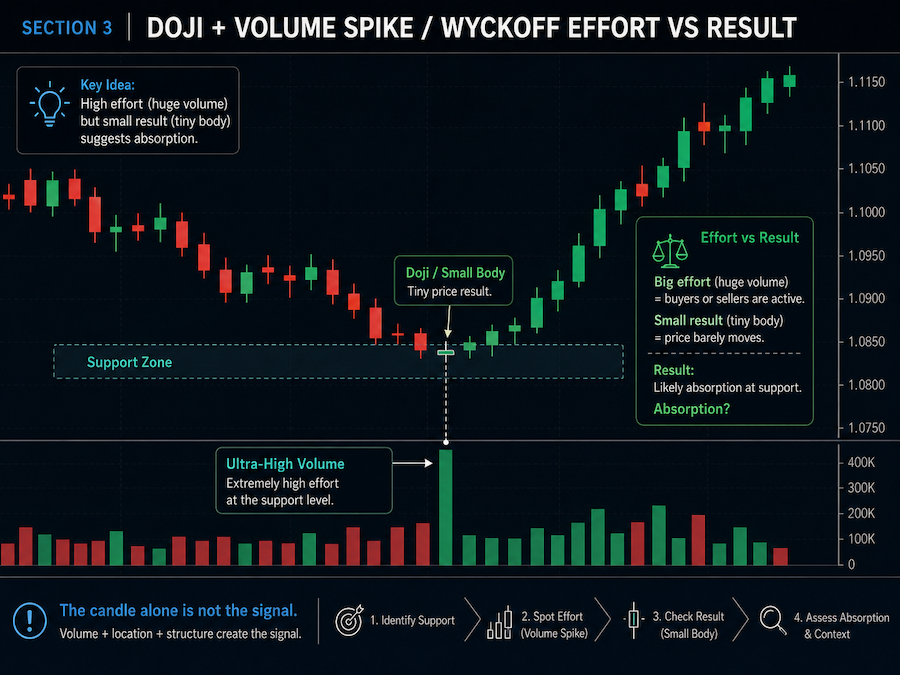
👉 Alt Text: How to read a high-volume Doji at support using Wyckoff effort-versus-result and possible absorption.
A high-volume Doji at support becomes more meaningful if:
- Downward progress repeatedly weakens
- Price recovers above the candle
- Supply decreases during the retest
- Bullish displacement develops
- Support continues to hold
- Meaningful resistance is later broken
The absorption interpretation fails if price accepts beneath support and continues lower.
A practical example of effort, failed acceptance, Sign of Weakness, and markdown is available in Bitcoin Wyckoff Redistribution: How the 6H Structure Confirmed Markdown.
Low Volume and Large Price Progress
A wide candle on relatively low volume can indicate that little opposing liquidity was available.
Price may travel quickly through a thin area because few participants are willing to transact there.
This should not automatically be interpreted as strong institutional conviction. The movement may retrace rapidly after reaching a deeper liquidity pool.
Low Volume and Limited Price Progress
Low volume with limited price movement often reflects reduced participation.
This may occur:
- Inside consolidation
- During quiet sessions
- In the center of a range
- Before a catalyst
- During a weak corrective movement
The correct decision is often patience rather than prediction.
Read Candlestick Sequences, Not Single Patterns
The most reliable candlestick information usually comes from a sequence.
A single candle is a local report. A sequence reveals whether the market accepted, rejected, or failed to continue.
Bullish Reversal Sequence
A structurally supported bullish reversal may develop through:
- Sell-side liquidity sweep
- Close back above the swept level
- Bullish displacement
- Break of a meaningful swing high
- Controlled retracement
- Higher low
- Continuation toward buy-side liquidity
Bearish Reversal Sequence
A bearish reversal may develop through:
- Buy-side liquidity sweep
- Failure to hold above the high
- Bearish displacement
- Break of meaningful support
- Weak retest
- Lower high
- Continuation toward sell-side liquidity
Breakout Acceptance Sequence
A genuine breakout may develop through:
- Strong body close beyond the boundary
- Follow-through
- Consolidation outside the previous range
- Successful retest
- Continued value formation beyond the level
- Expansion toward external liquidity
The pattern name is not the setup.
The complete structural sequence is the setup.
Confirmation, Invalidation, and Failure Logic
A professional candlestick thesis must define both confirmation and failure.
Confirmation
Confirmation may include:
- Candle-body reclaim
- Displacement
- Meaningful BOS or CHoCH
- Follow-through
- Successful retest
- Volume consistent with the response
- Acceptance on the expected side of the level
A CHoCH should not automatically be treated as a full trend reversal. Its importance depends on the timeframe, the swing that was broken, and the higher-timeframe environment.
Invalidation
A bullish lower-wick thesis may be invalidated if price:
- Accepts beneath the swept low
- Loses the bullish displacement origin
- Fails to hold the reclaimed level
- Continues forming lower highs
- Expands toward deeper sell-side liquidity
A bearish upper-wick thesis may be invalidated if price:
- Reclaims the wick high
- Closes and holds above resistance
- Forms support above the former boundary
- Invalidates bearish displacement
- Continues toward higher buy-side liquidity
Failure Logic
Failure logic identifies warning signs before the final structural stop is reached.
These may include:
- Weak follow-through
- Immediate return into the previous range
- Increasing volume without expected progress
- Repeated failure to hold the reclaim
- Contradiction from the controlling timeframe
The trader does not need to defend a candlestick interpretation after the market stops supporting it.
Common Candlestick Analysis Mistakes
Trading the Pattern Name
A hammer, Doji, engulfing candle, or Marubozu is a description—not a complete entry model.
Treating Every Wick as a Stop Hunt
A wick may access liquidity, but it may also reflect normal volatility or a temporary probe before continuation.
Assuming Every Large Candle Is Institutional
A large body shows repricing. It does not prove the identity or intention of the participants behind the movement.
Ignoring the Candle Close
A wick beyond a level and a body close beyond it can have materially different structural meanings.
Ignoring Follow-Through
A breakout candle without continued acceptance may become a liquidity trap.
The complete failure sequence is examined in Liquidity Trap Breakout: Confirmation Before Execution.
Treating High Volume as Automatically Bullish or Bearish
Volume measures activity. Price response and subsequent structure reveal the result.
Entering in the Middle of a Range
Candles near equilibrium often provide poor invalidation and limited distance to target liquidity.
Defining Targets Before Invalidation
A target has little value when the trader cannot explain where the candle thesis fails.
StructFirst Candlestick Analysis Checklist
Before using a candle for execution, verify:
- What is the controlling higher-timeframe structure?
- Where did the candle form?
- What liquidity was accessed?
- Was the level crossed by a wick or a body?
- Did meaningful displacement occur?
- Was the broken swing structurally relevant?
- Did price establish acceptance?
- Did volume support or contradict the movement?
- What confirms the thesis?
- What invalidates it?
- Where is the next opposing liquidity pool?
- Does the target justify the required risk?
- Is no-trade the better decision?
A candle that cannot answer these questions is not an executable trade plan.
When Not to Trade a Candlestick Setup
No-trade is appropriate when:
- The candle forms in the middle of unresolved structure
- No meaningful liquidity was accessed
- A wick forms without displacement
- A breakout forms without acceptance
- The lower-timeframe signal contradicts the controlling structure
- The invalidation is too wide relative to the target
- The efficient entry has already passed
- Volume and price response remain inconclusive
- The setup depends more on the pattern name than structural evidence
A missed candle is not necessarily a missed trade.
The market must provide a complete sequence before capital is committed.
Frequently Asked Questions
How do you read a candlestick correctly?
Begin with market structure and location. Then evaluate the wick, body, volume, liquidity interaction, displacement, acceptance, confirmation, and invalidation. A candle pattern should not be interpreted in isolation.
Is a long wick always rejection?
No. A wick confirms that price traded into an area and moved away before the close. It may represent liquidity access, volatility, absorption, or a temporary probe before continuation.
Does a candle-body close confirm a breakout?
A body close provides stronger evidence than a wick, but continued acceptance, follow-through, and a successful retest may still be required.
Does a high-volume Doji confirm absorption?
No. High effort with limited result may suggest absorption, but it can also represent conflict, churn, or position transfer. The following structure must confirm the interpretation.
Is a Marubozu candle always a continuation signal?
No. It shows strong movement during one period. Continuation fails if price cannot maintain acceptance, loses the displacement origin, or returns through the broken structure.
Expand Your Structural Edge
Learning how to read candlesticks requires more than memorizing patterns.
The wick shows where price traveled and where liquidity may have been accessed.
The body shows where price closed and whether displacement occurred.
Volume measures effort.
Follow-through reveals whether the market accepted the movement.
Invalidation defines where the interpretation fails.
Candles are footprints.
Market structure explains where those footprints lead.
Track the live order flow and volume footprint yourself directly on TradingView.
Leave a Reply