StructFirst Core Guide #005
A large bullish candle appears.
Its body is wider than the candles around it. Volume expands. Price breaks a recent high, and a Fair Value Gap forms behind the move.
Many traders immediately call it displacement.
Sometimes they are right.
Sometimes they are simply looking at volatility.
Displacement in trading is commonly described as a forceful price move composed of large candle bodies, limited overlap, and directional momentum. Those visual characteristics matter, but they do not complete the definition.
A large candle can form because of:
- a liquidation event,
- short covering,
- thin liquidity,
- a news release,
- temporary volatility expansion,
- or an aggressive move that is immediately rejected.
The candle may look powerful while producing no lasting structural change.
This is why StructFirst does not define displacement by candle size alone.
Displacement is an aggressive repricing event confirmed by context, structural consequence, acceptance, and follow-through.
The word repricing is central to this definition.
Price is not merely moving from one number to another. The market is leaving an area of relative balance, moving decisively through meaningful structure, and attempting to establish value in a new price area.
That transition may occur through one exceptional candle.
It may also develop across a sequence of expanding candles.
The important question is not:
How large was the candle?
The better question is:
What did the move change, and did the market accept that change?
A genuine displacement leg may:
- move away from a meaningful liquidity event,
- break the swing maintaining the previous auction,
- leave an imbalance or Fair Value Gap,
- establish acceptance beyond broken structure,
- create a protected high or low,
- and continue toward the next liquidity objective.
A dramatic candle that immediately returns to its origin may accomplish none of these things.
This distinction follows the central principle introduced in Why Market Structure Comes First: The StructFirst Trading Framework: visible price movement becomes useful only when it is interpreted through higher-timeframe structure, liquidity, confirmation, failure logic, and risk.
The analytical sequence for this guide is:
Location
→ Liquidity Event
→ Expansion
→ Structural Consequence
→ Acceptance
→ Follow-Through
Each stage answers a different question.
Location tells us whether the move began where a meaningful response was plausible.
Liquidity explains what the market was testing.
Expansion reveals whether price left the area with urgency.
Structural consequence identifies what the move actually broke or changed.
Acceptance shows whether price could remain in the new area.
Follow-through confirms whether repricing continued toward the next objective.
When these elements align, displacement becomes useful evidence.
When they do not, a large candle may be no more than a temporary burst of volatility.
Why Most Traders Misunderstand Displacement
The misunderstanding begins with how displacement is usually taught.
A typical diagram shows:
- one long candle,
- a small wick,
- an FVG,
- and a broken swing.
The movement is then labeled displacement.
This is visually convenient, but it teaches traders to recognize a shape instead of evaluating a process.
The same problem occurs with candlestick patterns. A trader sees a Hammer, Doji, Marubozu, or engulfing candle and assumes the pattern carries the same meaning everywhere.
It does not.
As explained in How to Read Candlesticks: Liquidity, Volume, and Market Structure, the meaning of a candle depends on its location, surrounding liquidity, volume, structural effect, and the response that follows.
Displacement must be read in the same way.
A Large Body Is Not Enough
A large candle body shows that price covered significant distance during that period.
It does not independently reveal:
- whether the movement began at a meaningful location,
- whether important liquidity had been accessed,
- whether the broken swing mattered,
- whether the market accepted the new price,
- or whether the movement would continue.
A candle can be large and still close directly into higher-timeframe resistance.
It can break an internal pivot while leaving external structure unchanged.
It can result from forced liquidations and reverse as soon as those orders have been absorbed.
High Volume Is Not Enough
Volume expansion shows increased participation or activity.
It does not independently identify which side gained lasting control.
High volume with strong directional progress may support a displacement thesis.
High volume with limited price progress may suggest absorption or significant opposing liquidity.
High volume followed by an immediate reclaim may reflect liquidation rather than sustainable repricing.
The useful question is not:
Was volume high?
It is:
What result did that volume produce?
An FVG Is Not Enough
A Fair Value Gap may form during genuine displacement because price traveled too quickly for balanced two-way trading to occur.
However, an imbalance can also form:
- during thin market conditions,
- during an isolated volatility spike,
- inside a larger range,
- or immediately before price reverses.
The existence of an FVG does not prove that the move changed meaningful structure.
An FVG is a footprint of movement. The context of the movement determines whether that footprint is meaningful.
The FVG should therefore be treated as evidence left by the repricing event rather than as proof of displacement itself. For the full imbalance framework, continue with How to Read a Fair Value Gap in Market Structure.
A Structural Label Is Not Enough
A large candle may trigger BOS or CHoCH on an indicator.
But the label depends on the sensitivity and swing logic used by that tool.
Breaking a minor internal pivot is not equivalent to breaking the protected swing that maintained the previous directional auction.
This distinction is examined in BOS vs CHoCH vs Market Structure Shift: What Actually Confirms a Trend Change?, where structural labels are treated as evidence rather than automatic entry signals.
A movement becomes more important when it creates a real structural consequence.
The candle’s appearance begins the investigation.
The consequence confirms its significance.
The StructFirst Definition of Displacement
StructFirst defines displacement as:
An aggressive one-sided repricing event that moves price away from a meaningful location, breaks relevant structure, and establishes acceptance in a new price area.
Every part of this definition matters.
Aggressive
Aggressive does not mean emotional or irrational.
It describes the observable behavior of price.
An aggressive move may show:
- expanded candle bodies,
- faster delivery,
- reduced overlap,
- closes near candle extremes,
- consecutive directional candles,
- and limited immediate retracement.
Price is leaving the previous area more efficiently than it was trading inside it.
One-Sided
Markets always contain buyers and sellers.
“One-sided” does not mean that only one group participated.
It means one side of the auction produced a visibly stronger result.
In bullish displacement:
- pullbacks become shallow,
- bearish candles make limited progress,
- bullish closes dominate,
- and price continues accepting higher.
In bearish displacement:
- rebounds become weak,
- bullish candles fail to recover structure,
- bearish closes dominate,
- and price continues accepting lower.
Repricing
Repricing separates displacement from ordinary volatility.
A volatile market may travel rapidly in both directions while remaining inside the same range.
Repricing carries price away from an established area and attempts to build value somewhere new.
This may involve:
- leaving a consolidation,
- reclaiming a failed breakdown,
- rejecting a failed breakout,
- moving through a protected swing,
- or breaking an external range boundary.
The result should alter the auction—not merely enlarge the candles inside it.
Meaningful Location
Displacement becomes more informative when it begins from a location where liquidity, rejection, continuation, or failed acceptance matters.
Examples include:
- higher-timeframe premium or discount,
- a previous swing high or low,
- equal highs or equal lows,
- a session boundary,
- previous-day or previous-week liquidity,
- a range extreme,
- a Wyckoff Spring or UTAD candidate,
- a harmonic Potential Reversal Zone,
- or an important support or resistance area.
A strong candle in the middle of an unresolved range may be activity without edge.
A similar candle after an external liquidity event may carry far greater structural meaning.
The importance of higher-timeframe location can also be seen in Bitcoin 4H Resistance Zone: Liquidity, Confirmation, and Invalidation, where lower-timeframe reactions could not be evaluated correctly without first understanding the larger resistance structure.
Relevant Structure
Displacement should be evaluated according to the structure it affects.
A move may break:
- a minor internal pivot,
- an execution-timeframe swing,
- a protected high or low,
- a range boundary,
- or a major external swing.
These breaks are not equal.
The more important the broken structure is to the prior auction, the more meaningful the displacement becomes.
A five-minute displacement can be highly relevant to an intraday execution while remaining insignificant to Daily structure.
Timeframe hierarchy still applies.
Acceptance
Acceptance is what separates a convincing break from a temporary excursion.
Bullish acceptance may appear when price:
- closes above broken resistance,
- remains above it,
- builds higher lows,
- holds a retest,
- and continues toward buy-side liquidity.
Bearish acceptance may appear when price:
- closes below broken support,
- fails to reclaim it,
- builds lower highs,
- holds below the boundary,
- and continues toward sell-side liquidity.
Acceptance does not require price to move in a straight line.
It requires the market to avoid immediately invalidating the repricing event.
The Before–During–After Framework
A displacement leg should never be evaluated from the expansion candle alone.
The complete analysis requires three stages.
Before the Move: What Created the Conditions?
Before labeling displacement, identify the market environment.
Ask:
- Where is price within higher-timeframe structure?
- Is it trading at premium, discount, or equilibrium?
- Is price near external liquidity?
- Has a session high or low been taken?
- Is the market compressed or balanced?
- Has a breakout failed?
- Is a Wyckoff Spring, Upthrust, or UTAD possible?
- Is price reacting from a meaningful PRZ or range boundary?
This stage explains why the movement began where it did.
A move without clear context may still become displacement, but the initial thesis is weaker because its source is unclear.
During the Move: How Did Price Leave?
Next, evaluate the quality of the expansion.
Ask:
- Did candle bodies expand?
- Did candle overlap decrease?
- Did candles close near their directional extremes?
- Did price travel efficiently?
- Did volume support the expansion?
- Did an FVG or imbalance form?
- Did the move break relevant structure?
- Was the movement one candle or a sustained leg?
This stage reveals force.
However, force alone does not confirm successful repricing.
After the Move: What Did the Market Accept?
The final stage is often the most important.
Ask:
- Did price remain beyond the broken structure?
- Was the move immediately reclaimed?
- Did the retest hold?
- Did price form a protected swing?
- Did the imbalance remain partially open?
- Did the market continue toward the next liquidity objective?
- Was the displacement origin defended?
- Did opposing candles produce meaningful progress?
This stage reveals consequence.
Before explains the context. During reveals the force. After confirms whether the repricing was accepted.
Many apparent displacement moves fail in the third stage.
The candle looked strong.
The market refused to hold the result.
Large Candles Are Not Automatically Displacement
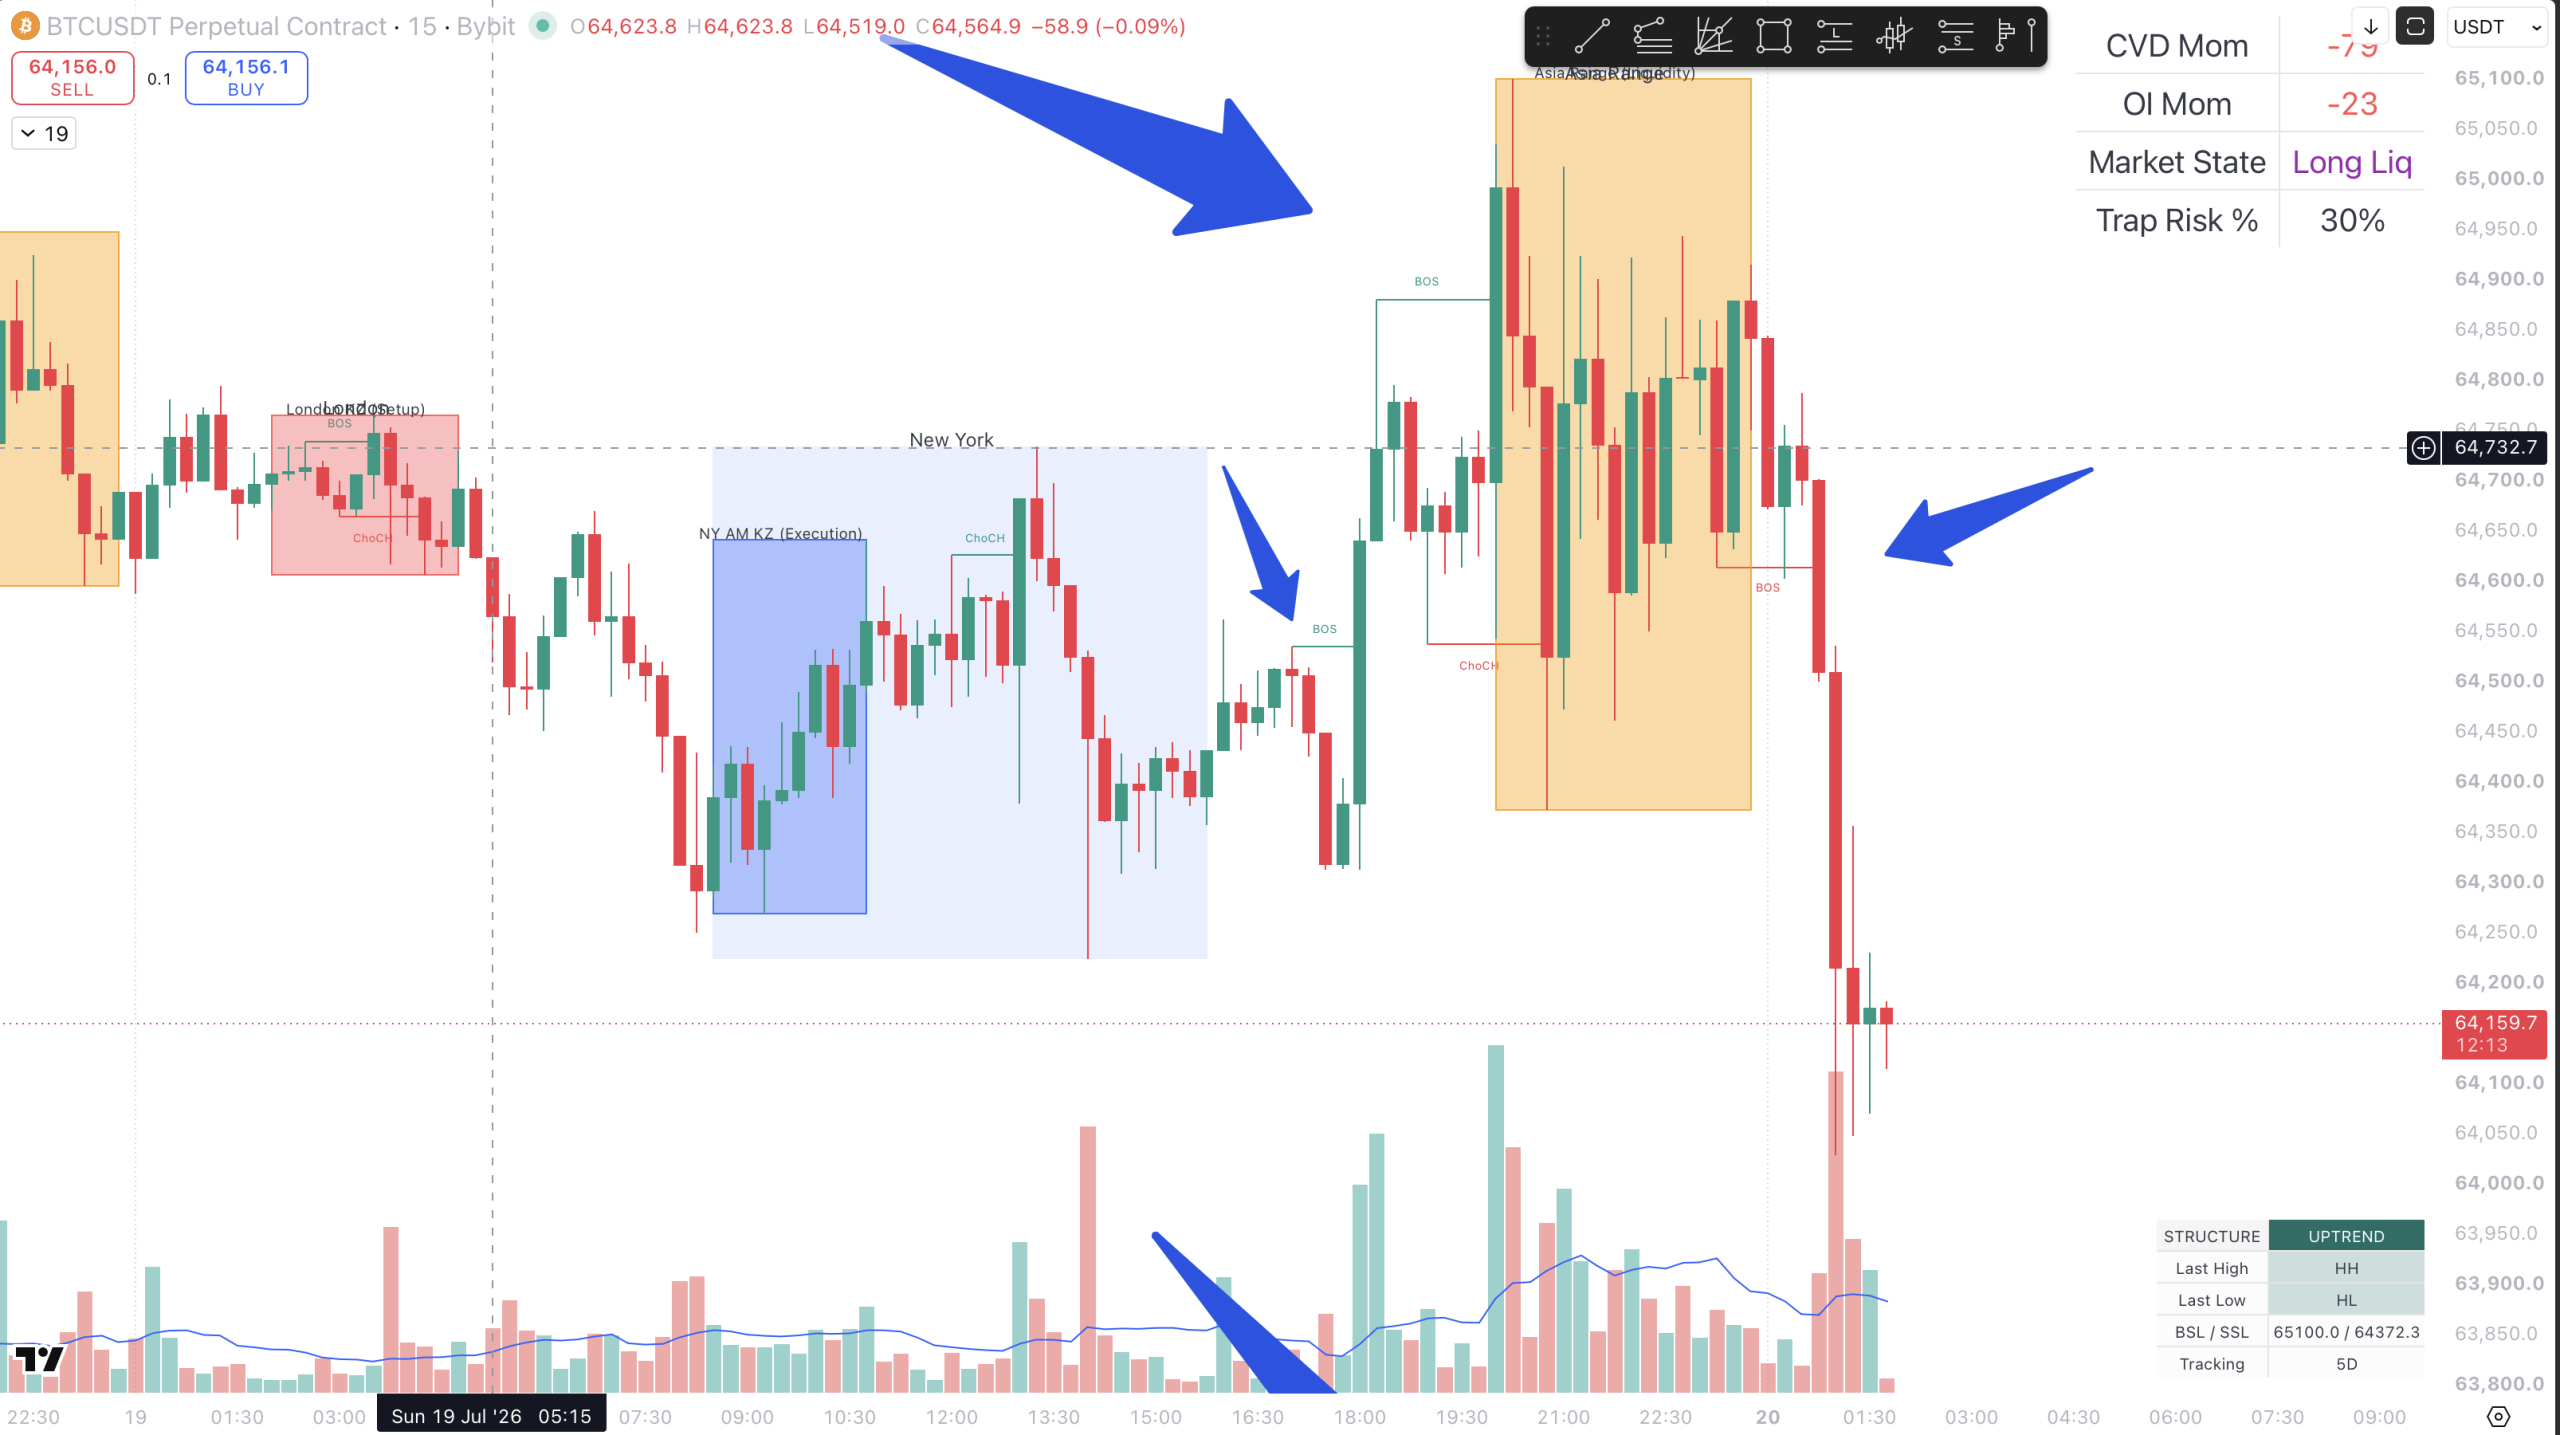
The upper highlighted area contains several visually strong candles.
There are:
- wide ranges,
- long wicks,
- significant two-way movement,
- and increased activity.
A trader focused only on candle size might describe several of these moves as displacement.
But the broader behavior tells a different story.
Price repeatedly moves up and down through the same area. Candle bodies overlap. Long wicks appear on both sides. Neither buyers nor sellers establish durable acceptance outside the local range.
There is effort.
There is volatility.
There is not yet a clean directional result.
The later bearish move is different.
Price begins to:
- close through meaningful internal support,
- produce consecutive bearish expansion,
- reduce candle overlap,
- remain below the broken area,
- and continue delivering lower.
The distinction is not that the bearish candles are simply larger.
The distinction is that they produce a structural consequence and maintain it.
Large candles show activity. True displacement shows that the activity changed the auction.
This chart also demonstrates why displacement may consist of a leg rather than one candle.
The first bearish candle begins the movement.
The next candles confirm that the move is not being immediately rejected.
Displacement becomes clearer as the sequence develops.
Failed Displacement: Why Acceptance Matters
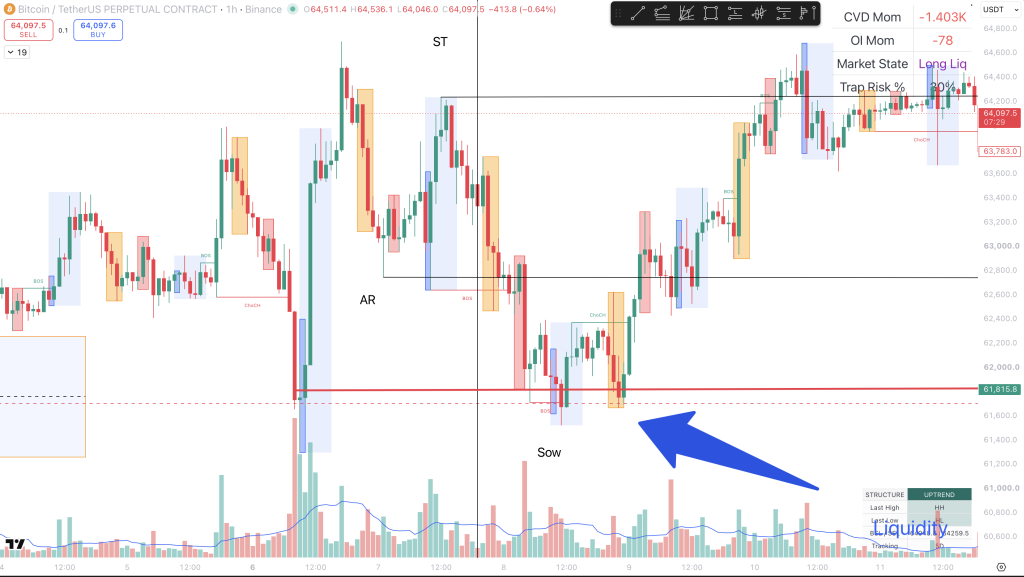
Near the left-center of this chart, price trades aggressively below the support area around 61.8K.
The candle is large.
Volume expands.
The support level is visibly broken.
At the moment of the break, the move appears to satisfy several common displacement criteria.
But the next stage changes the interpretation.
Price does not remain below support.
Instead, it:
- quickly reclaims the broken level,
- closes back inside the prior range,
- fails to extend toward lower liquidity,
- and begins bullish repricing in the opposite direction.
The bearish candle recorded strong activity.
It did not establish bearish acceptance.
The move therefore becomes better understood as:
Apparent Bearish Break
→ Volume Expansion
→ No Acceptance
→ Immediate Reclaim
→ Failed Bearish Displacement
This distinction matters in real time.
A trader does not need to know with certainty, at the first candle close, whether the movement will fail.
The trader needs conditions that reveal whether the thesis is being confirmed or invalidated.
For a bearish displacement thesis, useful confirmation may include:
- continued closes below support,
- inability to reclaim the broken level,
- a weak retest from beneath,
- formation of a protected lower high,
- and continued delivery toward sell-side liquidity.
Evidence of failure may include:
- immediate recovery above support,
- erasure of the bearish imbalance,
- strong bullish response from the sweep,
- and acceptance back inside the range.
A move through structure is not confirmed displacement when the market immediately rejects the new price area.
This does not mean the original candle must be ignored.
It means the candle begins a hypothesis.
The market’s response decides whether that hypothesis survives.
The Anatomy of High-Quality Displacement
No single condition confirms every displacement event.
The thesis becomes stronger as multiple forms of evidence align.
1. Meaningful Location
The move begins from an area that matters to the larger auction.
Examples include:
- external liquidity,
- premium or discount,
- a range boundary,
- previous-day or previous-week levels,
- a session extreme,
- a failed breakout,
- or a major structural decision point.
Location creates the reason to investigate the move.
It does not guarantee its success.
2. Liquidity Interaction
Price interacts with orders concentrated above or below a visible boundary.
The event may involve:
- a liquidity sweep,
- liquidation,
- breakout participation,
- trapped positioning,
- or a failed attempt to establish value outside a range.
The trader then evaluates how price responds.
A liquidity sweep should never be treated as automatic reversal. What Is a Liquidity Sweep? Confirmation, Failure, and Execution explains why the market’s response after the sweep determines whether the event becomes rejection, continuation, or genuine breakout acceptance.
3. Range Expansion
Directional candles become larger relative to recent price action.
The important comparison is local.
A candle does not need to meet a universal size threshold.
It needs to represent meaningful expansion relative to the market conditions preceding it.
4. Strong Close Quality
A bullish displacement candle often closes near its high.
A bearish displacement candle often closes near its low.
A strong close suggests that the opposing side failed to force price back through a meaningful portion of the range before the period ended.
One close is still not enough.
Subsequent acceptance must be evaluated.
5. Reduced Candle Overlap
Efficient repricing tends to leave less two-way overlap than ordinary range rotation.
This does not mean every candle must be the same color.
A small opposing candle can appear inside a valid displacement leg.
The relevant question is whether opposing candles reverse the move or merely pause it.
6. Structural Consequence
High-quality displacement should change something that matters.
It may:
- break a protected swing,
- produce CHoCH or MSS,
- confirm BOS,
- leave a trading range,
- reclaim a failed breakdown,
- or invalidate a previous directional thesis.
A large candle that breaks nothing meaningful remains lower-quality evidence.
7. Imbalance or FVG
An FVG can support the displacement thesis because it reflects inefficient two-way trade during rapid delivery.
However:
- not every displacement requires a visible FVG,
- not every FVG comes from meaningful displacement,
- and an FVG does not become an automatic entry zone.
The imbalance must remain connected to the context and structural consequence of the move that created it.
8. Acceptance
Price holds beyond the affected structure.
Acceptance may be confirmed through:
- sustained closes,
- a successful retest,
- a defended displacement origin,
- or continued formation of value in the new area.
This is where many apparent displacement events fail.
9. Follow-Through
Price continues delivering toward a logical liquidity objective.
Follow-through does not need to occur without retracement.
The retracement must simply avoid invalidating the structural consequence of the move.
The more meaningful consequences a move leaves behind, the stronger the displacement thesis becomes.
A strong candle may begin the story.
Displacement is confirmed by what the market does with that candle afterward.
Liquidity Creates the Event
Displacement becomes more meaningful when price moves away from a completed liquidity event.
This does not mean every displacement must begin with a visible liquidity sweep.
A market can also displace during:
- a confirmed breakout,
- trend continuation,
- a reaction from higher-timeframe support or resistance,
- a failed retest,
- or the release of prolonged consolidation.
However, liquidity often explains why the market suddenly changes speed near an obvious high or low.
A prior swing contains resting orders.
A breakout attracts new participation.
Protective stops are triggered.
Existing positions may be liquidated.
Once those orders are executed, the market must reveal whether the level is being accepted or rejected.
That response is more important than the sweep itself.
A higher-quality bullish reversal sequence may develop as:
Higher-Timeframe Discount
→ Sell-Side Liquidity Sweep
→ Reclaim
→ Bullish Displacement
→ CHoCH or MSS
→ BOS
→ Acceptance
→ Buy-Side Liquidity Objective
A higher-quality bearish reversal sequence may develop as:
Higher-Timeframe Premium
→ Buy-Side Liquidity Sweep
→ Failed Acceptance
→ Bearish Displacement
→ CHoCH or MSS
→ BOS
→ Acceptance
→ Sell-Side Liquidity Objective
The liquidity event creates the conditions.
Displacement reveals whether the market is actually leaving that event with directional intent.
Bullish Displacement After a Sell-Side Liquidity Sweep
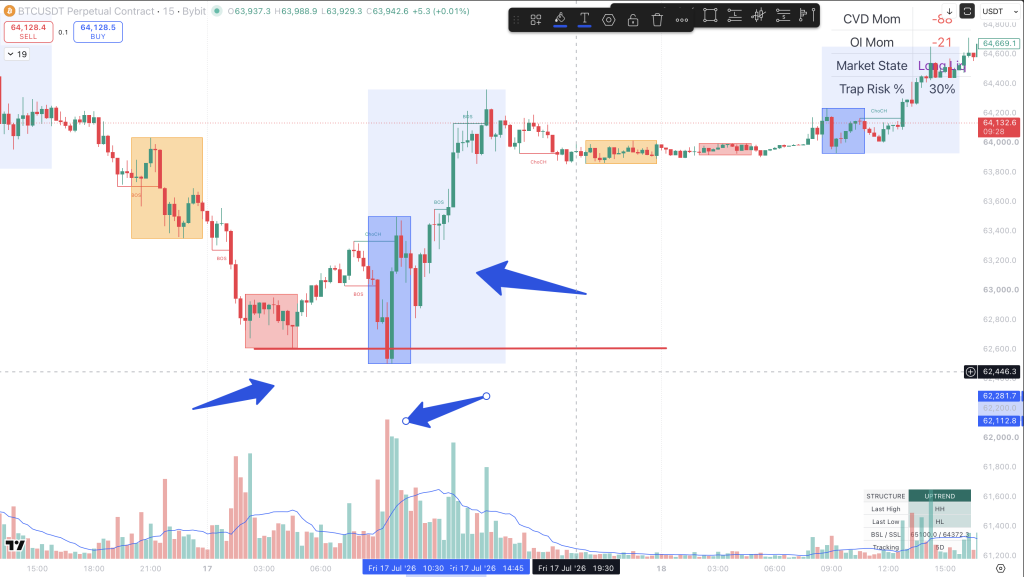
The highlighted low around 62.6K provides a clear example of the complete displacement process.
Before the move, Bitcoin was trading in a bearish sequence.
Price had:
- formed lower highs,
- broken internal support,
- continued delivering toward sell-side liquidity,
- and approached an obvious low beneath the prior range.
The move below that low initially appeared bearish.
Stops were likely resting beneath the visible structure. Breakout sellers may also have entered as support failed.
But price did not remain below the level.
Instead, the market reclaimed the low and began moving higher with a different character.
The response included:
- a clear rejection of lower prices,
- expanding bullish candle bodies,
- increased volume,
- reduced overlap,
- a bullish CHoCH,
- multiple BOS events,
- and sustained delivery toward 64.2K.
This is not simply a bullish candle appearing at support.
It is a sequence in which the previous bearish auction loses control.
The Sweep Was Not the Confirmation
The first wick below the low did not confirm reversal.
At that moment, price could still have accepted below support and continued lower.
The evidence developed afterward.
The bullish case became stronger as price:
- reclaimed the swept level,
- closed back inside prior structure,
- displaced through the first meaningful lower high,
- continued through additional resistance,
- and remained above the structures it had broken.
The sequence can be summarized as:
Sell-Side Liquidity Sweep
→ Failed Breakdown
→ Bullish Reclaim
→ Volume Expansion
→ Bullish Displacement
→ CHoCH
→ BOS
→ Acceptance
→ Continuation
The sweep created the event. Displacement confirmed that price was being repriced away from the liquidity zone.
A similar intraday sequence can be studied in BTC 30M: The London Session Liquidity Sweep and ICT Turtle Soup, where session liquidity was taken before the lower-timeframe structural response became useful.
Structural Consequence Matters More Than Candle Size
Several bullish candles in the sequence are large.
But candle size is not the primary reason this qualifies as displacement.
The more important evidence is what the bullish leg accomplished.
It broke the bearish progression.
It moved through multiple structural levels.
It established acceptance above prior resistance.
It continued toward a logical buy-side objective.
The market did not merely bounce from the low.
It changed the way price was being delivered.
Volume Supported the Move but Did Not Define It
Volume expanded near the liquidity sweep and during bullish repricing.
That strengthens the displacement thesis because increased effort produced meaningful directional progress.
However, volume should not be isolated from structure.
The same volume expansion would carry less significance if price had:
- failed to reclaim the low,
- remained trapped beneath resistance,
- or immediately returned to the sweep area.
The useful relationship is:
Volume expanded, price progressed, structure changed, and the move held.
All four observations matter.
Bearish Displacement After a Failed Auction
Bullish displacement often begins after price fails to accept below sell-side liquidity.
Bearish displacement frequently develops after the opposite event.
Price trades above a prior high, attracts breakout participation, triggers buy-side liquidity, and then fails to maintain value above the level.
The move above resistance is not automatically a UTAD.
It is not automatically a liquidity trap.
And it is not automatically bearish.
The market must confirm failure.
That confirmation often appears through displacement.
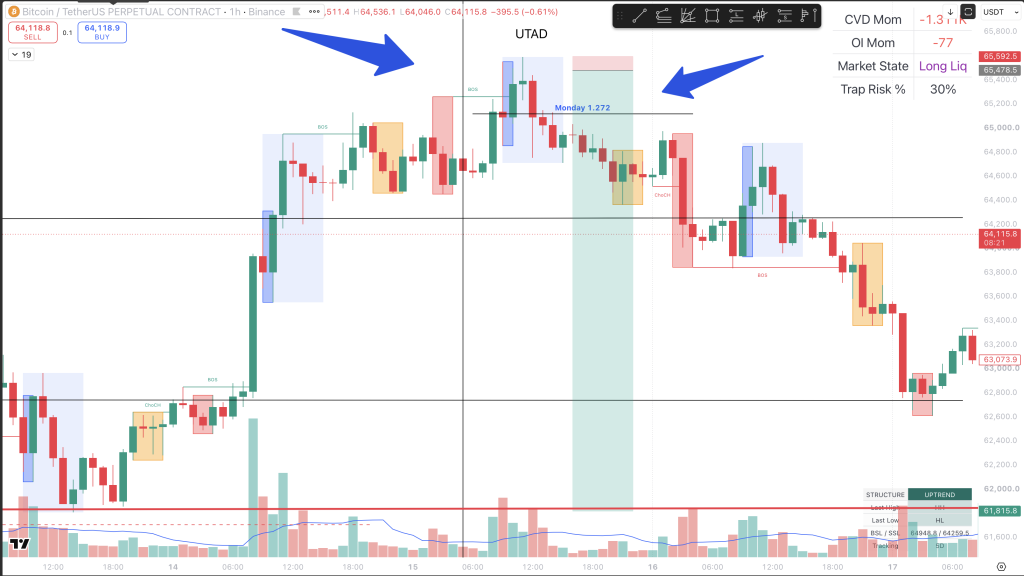
This chart begins with a strong bullish advance into higher-timeframe premium.
Price reaches:
- a previous high,
- the Monday 1.272 extension,
- visible buy-side liquidity,
- and a potential Wyckoff UTAD location.
At first, the move above the high could still have represented genuine breakout continuation.
A trader should not assume reversal simply because price moved into a harmonic extension or above a range boundary.
The key question was:
Could Bitcoin establish acceptance above the breakout?
It could not.
Price returned below the high and began producing weaker bullish responses.
The subsequent bearish movement:
- expanded through local support,
- broke a meaningful protected low,
- produced a bearish CHoCH,
- confirmed BOS in the new direction,
- and continued into markdown.
This is the structural consequence that gives the UTAD interpretation credibility.
UTAD Is a Hypothesis Before Displacement
A Wyckoff label should describe market behavior rather than replace confirmation.
The move above the high can be viewed as a UTAD candidate because it:
- occurred after an extended advance,
- traded through visible buy-side liquidity,
- failed to sustain value above the range,
- and was followed by meaningful weakness.
But the label did not create the short setup.
The bearish displacement did.
The UTAD identified where failure could occur. Bearish displacement confirmed that the failure produced structural consequences.
This process is applied in real time in UTAD Short Setup: Structural Trading and Trap Execution, where the move above resistance mattered only after the market failed to hold the breakout and defined a structural failure point.
Failed Acceptance Precedes Bearish Repricing
The important transition is:
Breakout Attempt
→ Liquidity Taken
→ No Sustained Acceptance
→ Bearish Expansion
→ Protected Low Broken
→ Bearish Acceptance
The first red candle was not enough.
The displacement thesis became stronger as multiple bearish candles continued through structure and price failed to recover the broken level.
This is why reversal should not be defined from the top wick alone.
The wick reveals liquidity interaction.
The bearish displacement reveals the transfer of control.
The Same Large Candle Can Mean Different Things
A large bearish candle after a UTAD candidate can be meaningful when:
- it breaks relevant structure,
- closes near its low,
- receives follow-through,
- and remains below the failed breakout area.
A similarly large bearish candle in the middle of a range may represent temporary volatility.
The difference is not the candle.
The difference is the sequence.
The broader transition from balance into markdown is also demonstrated in Bitcoin Wyckoff Redistribution: How the 6H Structure Confirmed Markdown, where weakness became actionable only after the larger range failed to sustain bullish acceptance.
Displacement vs Volatility, Breakout, and Impulse
Several trading terms are often used interchangeably even though they describe different aspects of price behavior.
The distinction does not need to become overly academic.
It only needs to improve decision-making.
Volatility
Volatility describes the magnitude or speed of price movement.
A volatile market may produce:
- wide candle ranges,
- long wicks,
- rapid directional changes,
- large volume,
- and repeated stop-outs.
Volatility does not require structural progress.
Price can remain inside the same range while moving violently in both directions.
Volatility describes how much price moved. Displacement describes whether the movement repriced the auction.
Breakout
A breakout occurs when price trades through a visible boundary.
The boundary may be:
- resistance,
- support,
- a session high or low,
- a range edge,
- a trendline,
- or a previous swing.
A breakout describes the event.
It does not confirm the result.
After the breakout, price may:
- accept beyond the boundary,
- retest and continue,
- sweep liquidity and reverse,
- or return immediately into the range.
Displacement may accompany a breakout, but the terms are not identical.
A valid breakout can occur gradually.
A violent breakout can fail.
The market’s acceptance after the boundary is crossed remains essential.
This distinction is explored in The Liquidity Trap Breakout, where the quality of acceptance matters more than the initial move through the level.
Displacement
Displacement describes aggressive repricing that produces meaningful structural consequences.
It usually includes some combination of:
- speed,
- range expansion,
- directional efficiency,
- a relevant structural break,
- imbalance,
- acceptance,
- and follow-through.
Displacement can occur:
- during reversal,
- during breakout,
- during trend continuation,
- or after a failed auction.
It is not limited to turning points.
Impulse
Impulse is often used as a broad synonym for a strong directional move.
Many traders use “impulse” and “displacement” interchangeably, and there is no universal naming standard.
StructFirst separates them for educational clarity.
Displacement refers to the aggressive repricing event that changes or confirms structure.
Impulse continuation refers to the directional expansion that continues after repricing has been accepted.
The sequence may look like:
Liquidity Event
→ Initial Displacement
→ Structural Shift
→ Acceptance
→ Impulsive Continuation
Displacement creates the shift. Impulse continuation extends the shift.
This does not mean every move can be divided into perfectly separate stages.
Sometimes displacement and impulse continuation appear as one continuous leg.
The distinction is a decision-making framework, not a rigid labeling requirement.
FVG Is a Footprint of Displacement, Not the Signal
Fair Value Gaps have become one of the most widely discussed concepts in modern price-action trading.
They are also frequently used without context.
A trader sees a three-candle imbalance and assumes price must return to it.
Another sees a bullish FVG and enters long without considering higher-timeframe structure, the liquidity event, or the origin of the move.
This reverses the analytical priority.
A meaningful FVG is often the result of displacement.
It is not the cause of displacement.
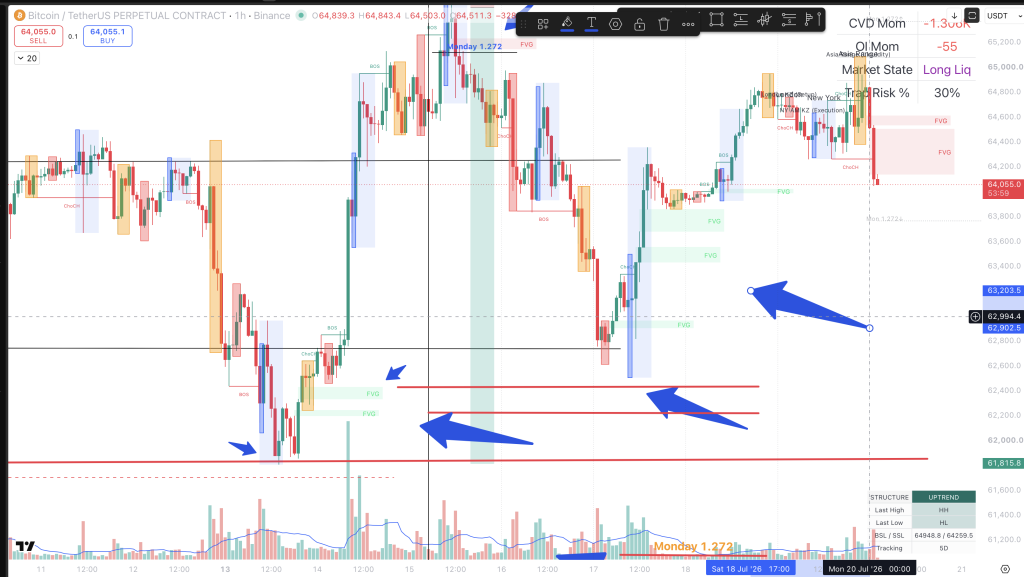
This chart shows the complete life cycle of a structurally meaningful imbalance.
Bitcoin first reacts from the broader sell-side liquidity area near 61.8K.
The market then:
- reclaims the low,
- produces bullish displacement,
- breaks multiple structural levels,
- creates several bullish FVGs,
- establishes acceptance above prior resistance,
- and continues toward the upper range.
The FVGs are important because of the repricing leg that created them.
They were not isolated gaps inside random consolidation.
They developed while price was aggressively leaving a meaningful liquidity zone and changing the auction.
Displacement Created the Imbalance
The correct sequence is:
Liquidity Reaction
→ Bullish Displacement
→ Structural Break
→ FVG Creation
→ Acceptance
→ Impulsive Continuation
Not:
FVG Appears
→ Automatic Long Entry
The imbalance is evidence that price moved quickly.
The structural context tells us why that speed mattered.
The FVG matters because of the displacement that created it—not because every three-candle imbalance deserves a trade.
A Displacement Leg Can Create Several FVGs
High-quality repricing does not always leave one perfect imbalance.
A sustained directional leg may create multiple FVGs at different prices.
These imbalances can represent different parts of the move:
- the displacement origin,
- an early structural break,
- continuation through resistance,
- or later acceleration.
They should not automatically receive equal importance.
A trader should evaluate:
- which FVG formed nearest the liquidity event,
- which one accompanied the meaningful structural break,
- whether the surrounding structure remained valid,
- and whether price had already become too extended.
The oldest or deepest FVG is not automatically the best entry.
The nearest FVG is not automatically the safest.
Context determines relevance.
The Later Return Toward the FVG Cluster
Several sessions after bullish repricing, Bitcoin pulls back toward the lower imbalance area.
The chart does not show a precise full fill of the deepest FVG.
Instead, price returns toward the lower FVG cluster and the broader origin of bullish displacement.
Buyers respond before the entire imbalance is filled.
This is an important lesson.
An FVG is an area of interest, not a requirement that price must completely fill.
A bullish response can begin:
- at the upper boundary,
- near the midpoint,
- close to the displacement origin,
- around adjacent support,
- or slightly before the FVG is reached.
This behavior is sometimes described as front-running the imbalance.
However, the trader should avoid treating every near-touch as confirmation.
The response still matters.
In this example, the broader bullish thesis remained stronger because:
- the external low remained protected,
- price did not establish bearish acceptance beneath the demand area,
- bullish structure recovered,
- and the market later continued toward 64.8K.
The FVG supplied a location to monitor.
The structural response confirmed whether the location remained valid.
Impulsive Continuation Confirmed the Repricing
After the initial displacement established the structural shift, price transitioned into impulsive continuation.
The move extended through additional resistance and built value at higher prices.
This later expansion matters because it shows that the displacement was not immediately rejected.
The market accepted the repricing.
Displacement created the imbalance. Impulsive continuation confirmed that the repricing was being accepted.
This sequence also shows why displacement should not always be reduced to one candle.
The original repricing developed across a directional leg.
Multiple candles contributed to:
- structure breaking,
- FVG formation,
- acceptance,
- and continued delivery.
The trader should evaluate the complete leg rather than searching for one perfect displacement candle.
Volume and Wyckoff Effort Versus Result
Volume is useful when interpreted alongside price progress.
It becomes misleading when treated as an independent directional signal.
Wyckoff’s effort-versus-result principle provides a useful framework.
Effort refers to participation, commonly observed through volume.
Result refers to how far and how effectively price moves.
The relationship between the two can reveal whether activity produced directional control.
High Volume and Strong Price Progress
When volume expands and price makes sustained directional progress, the two may support a displacement thesis.
Examples include:
- strong candle-body expansion,
- meaningful structure breaking,
- limited overlap,
- acceptance beyond the level,
- and continued delivery.
Image 2 provides a clear example.
Volume expands after the sell-side sweep, and price proceeds through multiple bearish structural levels.
Effort produces result.
High Volume and Limited Progress
High volume with limited price movement can suggest absorption or strong opposing participation.
This is visible when:
- candle ranges remain wide but overlapping,
- long wicks form on both sides,
- price repeatedly returns to the same area,
- or progress stalls despite increasing activity.
Image 1 illustrates this condition in the upper range.
The highlighted auction contains significant effort, but directional result remains limited until the later bearish structural response clarifies control.
High volume is not displacement when the market cannot establish progress away from the area.
High Volume and Immediate Reclaim
A volume spike during a break can result from:
- stop losses being triggered,
- forced liquidation,
- breakout orders,
- or aggressive participation that is absorbed.
If price immediately reclaims the broken level, the large volume may describe the liquidity event rather than confirm continuation.
Image 5 is the clearest example.
The large bearish candle and volume spike appear convincing, but price fails to remain below support.
The result contradicts the initial bearish appearance.
Low Volume and Strong Price Progress
Price can occasionally travel quickly without unusually high volume.
This may occur during:
- thin liquidity,
- a liquidity vacuum,
- a low-participation session,
- or a lack of opposing orders.
Such a move can still produce structural consequences, but the trader should remain cautious.
Efficient movement through thin liquidity may reverse quickly when the market reaches deeper participation.
Volume is therefore neither mandatory nor sufficient for displacement.
It is supporting evidence.
Volume measures effort. Price response reveals whether that effort produced control.
The final judgment should combine:
- location,
- liquidity,
- price progress,
- structural consequence,
- acceptance,
- and follow-through.
The contrast between accumulation and redistribution also demonstrates why volume must remain conditional. Compare BTC 12H Structure: The Wyckoff Accumulation Hypothesis with the earlier redistribution case: similar volume expansion can support different narratives until price confirms acceptance, failure, and directional progress.
How Displacement Connects to CHoCH, MSS, and BOS
Displacement is one of the main bridges between liquidity and structural confirmation.
A liquidity event alone does not confirm reversal.
A CHoCH alone may represent only an internal rotation.
A BOS alone may occur inside a larger range.
Displacement helps evaluate whether the structural label reflects genuine repricing.
Displacement and CHoCH
CHoCH usually describes the first meaningful break against previous order flow.
A CHoCH can appear without strong displacement.
For example, price may slowly drift through a minor protected swing.
That still represents behavioral change, but the evidence remains limited.
A CHoCH supported by displacement is more meaningful because the market did not merely cross the swing.
It repriced through it.
The distinction is:
Minor Swing Break
→ Possible Behavioral Warning
versus:
Liquidity Event
→ Displacement
→ Protected Swing Break
→ Stronger Structural Shift
CHoCH creates the hypothesis.
Displacement improves the quality of that hypothesis.
Displacement and MSS
StructFirst applies a higher standard to Market Structure Shift than to a minor CHoCH.
A meaningful MSS should usually include:
- a relevant liquidity event,
- aggressive repricing,
- a break of a protected swing,
- strong closes,
- reduced overlap,
- and acceptance beyond structure.
In other words, displacement is often what separates a small countertrend break from a genuine structural shift.
A CHoCH can warn that behavior changed. Displacement helps confirm that the market actually repriced.
Displacement and BOS
BOS often confirms continuation in the direction of the new or existing auction.
In a reversal model, the sequence may be:
Liquidity Sweep
→ Displacement
→ CHoCH or MSS
→ Retest
→ BOS
→ Continuation
In a trend-continuation model, the sequence may be:
Pullback
→ Support or Resistance Holds
→ Continuation Displacement
→ BOS
→ Next Liquidity Objective
Displacement does not always create reversal.
It can also confirm that the existing trend remains active.
Not Every Displacement Confirms a Trend Change
A strong bullish displacement on the five-minute chart may represent only a corrective rally inside a bearish four-hour structure.
A strong bearish displacement on the fifteen-minute chart may represent only a pullback inside a Daily uptrend.
The relevant timeframe determines significance.
The trader must still ask:
- What structure was broken?
- Was it internal or external?
- Which timeframe controls the trade thesis?
- Where did the displacement begin?
- What liquidity objective remains ahead?
- Did higher-timeframe acceptance change?
Displacement confirms force and repricing.
It does not remove timeframe hierarchy.
Bullish Displacement Execution Model
A higher-quality bullish setup may develop as:
Higher-Timeframe Discount
→ External Sell-Side Liquidity
→ Sweep or Failed Breakdown
→ Bullish Reclaim
→ Bullish Displacement
→ CHoCH or MSS
→ Retest
→ BOS
→ Execution
→ Buy-Side Liquidity Target
Step 1: Establish Higher-Timeframe Context
Identify:
- the dominant market structure,
- range boundaries,
- premium and discount,
- major swing lows,
- and potential sell-side liquidity.
Without this step, bullish displacement may be only a lower-timeframe correction inside a larger bearish auction.
Step 2: Identify the Liquidity Event
Price trades beneath a meaningful low.
Do not assume reversal.
Observe whether the market:
- reclaims the level,
- closes back inside the range,
- produces absorption,
- or begins bullish expansion.
Step 3: Require Structural Consequence
Bullish displacement should break a swing that matters.
A small internal pivot may improve execution timing.
A protected lower high or important range boundary provides stronger evidence.
Step 4: Evaluate Acceptance
Ask:
- Did price remain above the broken swing?
- Was the first pullback shallow?
- Did the bullish FVG remain respected?
- Did sellers regain control?
- Did price form a protected higher low?
Step 5: Select an Execution Location
Possible execution areas include:
- the displacement origin,
- a structurally relevant FVG,
- the broken swing retest,
- a protected higher low,
- or a confirmed reclaim.
The existence of an FVG alone does not justify entry.
Step 6: Define Invalidation
Possible invalidation may include:
- acceptance back below the sweep,
- failure of the protected higher low,
- bearish displacement through the bullish origin,
- or complete structural failure beneath the reclaimed area.
Invalidation must be defined before targets.
Step 7: Target Liquidity
Potential objectives include:
- internal highs,
- session highs,
- previous-day high,
- external buy-side liquidity,
- or a higher-timeframe imbalance.
Image 2 provides the clean liquidity-to-displacement reversal model.
Image 4 shows how the same bullish repricing can later create retracement locations and impulsive continuation.
Bearish Displacement Execution Model
A higher-quality bearish setup may develop as:
Higher-Timeframe Premium
→ External Buy-Side Liquidity
→ Sweep or Failed Breakout
→ Failed Acceptance
→ Bearish Displacement
→ CHoCH or MSS
→ Retest
→ BOS
→ Execution
→ Sell-Side Liquidity Target
Step 1: Establish Premium and Buy-Side Liquidity
Identify:
- a major swing high,
- previous-day or previous-week high,
- session liquidity,
- a range boundary,
- harmonic extension,
- or a potential Wyckoff Upthrust or UTAD.
Step 2: Observe the Breakout Attempt
Price trades through the high.
Do not assume that the move is a liquidity trap.
The critical issue is whether price can maintain value above the level.
Step 3: Look for Failed Acceptance
Bearish evidence becomes stronger when price:
- closes back below the swept high,
- fails to recover the breakout area,
- produces weaker bullish reactions,
- and begins expanding lower.
Step 4: Require Structural Consequence
A bearish displacement should challenge or break the protected swing that maintained bullish order flow.
A top wick alone is not enough.
Step 5: Evaluate the Retest
A failed reclaim of broken support or a bearish FVG may provide execution.
Ask:
- Did the retest produce weak bullish progress?
- Did price remain beneath the displacement origin?
- Did a protected lower high form?
- Did sellers resume delivery?
Step 6: Define Invalidation
Possible invalidation may include:
- acceptance above the swept high,
- recovery of the bearish displacement origin,
- failure of the protected lower high,
- or bullish displacement through the setup structure.
Step 7: Target Sell-Side Liquidity
Potential targets include:
- internal lows,
- session lows,
- previous-day low,
- range equilibrium,
- external sell-side liquidity,
- or a higher-timeframe downside objective.
Image 3 provides the complete failed-auction model.
The UTAD did not trigger the trade.
The bearish displacement, failed retest, and continuation created the executable structure.
Weak Displacement vs High-Quality Displacement
| Weak or Unconfirmed Move | High-Quality Displacement |
|---|---|
| Large candle only | Context-supported repricing |
| No meaningful location | Begins at a relevant structural location |
| No clear liquidity event | Follows liquidity interaction or valid continuation context |
| Heavy candle overlap | Reduced overlap and directional efficiency |
| Weak or indecisive close | Strong close near the directional extreme |
| Breaks a minor pivot only | Breaks meaningful or protected structure |
| No acceptance | Acceptance beyond broken structure |
| Immediate reclaim | Holds the new price area |
| FVG only | FVG plus structural consequence |
| Volume without progress | Effort produces directional result |
| No follow-through | Continued delivery toward liquidity |
| No clear invalidation | Failure point can be defined objectively |
A strong candle becomes meaningful only when the market confirms what that candle changed.
Common Displacement Mistakes
1. Calling Every Large Candle Displacement
A large range measures activity.
It does not automatically confirm repricing.
2. Treating Every FVG as Proof
An FVG may be created by thin liquidity, random volatility, or a move that immediately fails.
Evaluate the displacement that created it.
3. Ignoring the Liquidity Event
A trader sees the expansion but does not understand what price was testing before the move began.
4. Ignoring Higher-Timeframe Location
Bullish displacement directly into higher-timeframe resistance may offer limited upside.
Bearish displacement into deep discount may offer limited downside.
5. Measuring Candle Size Without Structural Consequence
The most important issue is not how far the candle traveled.
It is what structure the move changed.
6. Confusing Volatility With Repricing
Violent two-way movement inside a range can produce large candles without directional acceptance.
7. Declaring Displacement Before the Candle Closes
An expansion candle can lose most of its body before closing.
Close quality matters.
8. Ignoring Immediate Reclaim
A move that is immediately reclaimed may represent liquidity collection rather than accepted repricing.
9. Chasing After the Move Is Extended
Correctly identifying displacement does not mean the current price still offers a good entry.
10. Assuming High Volume Proves Direction
Volume measures effort.
Price progress and acceptance reveal the result.
11. Treating Displacement as Proof of Institutional Identity
A chart can show aggressive participation and repricing.
It cannot independently prove exactly which institution initiated the move.
12. Ignoring Invalidation
A displacement thesis without an objective failure point remains an opinion.
Real Trading Lesson: You May Already Be Reading Displacement
Experienced traders often recognize displacement before they can formally define it.
They may describe it in less technical language:
- “This is not a normal bounce.”
- “The character of the move changed.”
- “That bearish candle actually broke the structure.”
- “Volume was high, but price did not go anywhere.”
- “The candle was large, but it was immediately reclaimed.”
- “After the sweep, price started delivering differently.”
These observations are already forms of displacement analysis.
The purpose of a framework is not to replace trading intuition.
It is to make that intuition repeatable.
A trader may correctly feel that a move is different because the brain is combining:
- speed,
- candle expansion,
- reduced overlap,
- liquidity location,
- structural consequence,
- volume,
- and follow-through.
Without a framework, those observations remain difficult to explain and difficult to apply consistently.
The StructFirst process converts that experience into questions:
- Where did the move begin?
- What liquidity was involved?
- How did price leave the area?
- What structure did the move change?
- Did the market accept the new price?
- Where does the thesis fail?
- Is there still an executable trade?
Experienced traders often recognize displacement before they can formally define it. A framework turns that intuition into a repeatable decision process.
The StructFirst Displacement Checklist
Location
- Is the move beginning from a meaningful area?
- Is price in premium, discount, or equilibrium?
- Is the market near external liquidity?
- Is the move occurring at a range boundary or in the middle?
Liquidity
- Was buy-side or sell-side liquidity taken?
- Was the event a sweep, breakout, or liquidation?
- Did price reclaim or reject the level?
- Does meaningful liquidity remain unfinished?
Expansion
- Did candle bodies expand relative to recent conditions?
- Did overlap decrease?
- Did price close near the directional extreme?
- Did an imbalance form?
- Was the move efficient or highly erratic?
Structural Consequence
- Which swing was broken?
- Was the swing internal or external?
- Did the move create CHoCH, MSS, or BOS?
- Did it alter the prior auction or merely move inside it?
Acceptance
- Did price remain beyond broken structure?
- Did the retest hold?
- Was the move immediately reclaimed?
- Was the displacement origin defended?
- Did a protected swing form?
Follow-Through
- Did price continue toward the next liquidity objective?
- Did opposing candles produce meaningful progress?
- Is directional delivery still intact?
- Did impulse continuation confirm the repricing?
Risk
- Where does the displacement thesis fail?
- Is the entry already too far from the origin?
- Is the target worth the structural risk?
- Can invalidation be defined before entry?
When several answers remain unclear, the correct decision may be:
No Trade.
No-Trade Conditions
Displacement may appear visually impressive while still offering no professional entry.
StructFirst considers no-trade valid when:
- price is in the middle of an unresolved range,
- no meaningful location or liquidity event is present,
- a large candle moves directly into opposing higher-timeframe structure,
- the break is immediately reclaimed,
- candle overlap remains excessive,
- the protected swing is unclear,
- acceptance cannot be confirmed,
- the entry is too far from the displacement origin,
- the reward-to-risk is poor,
- the move depends only on an FVG,
- volume expands but price makes limited progress,
- a news spike has not yet been accepted,
- or invalidation cannot be defined.
A dramatic candle is not a reason to chase price.
No trade remains valid when confirmation arrives too late or risk cannot be structured.
Frequently Asked Questions
Is Every Large Candle Displacement?
No.
A large candle shows range expansion. Displacement requires context, structural consequence, acceptance, and follow-through.
Does Displacement Require an FVG?
No.
An FVG frequently appears during rapid repricing, but a meaningful displacement can occur without a clearly visible imbalance.
Does Displacement Require High Volume?
No.
Volume can strengthen the thesis when increased effort produces directional progress, but displacement can also occur through thin liquidity or a liquidity vacuum.
Can Displacement Occur Without a Liquidity Sweep?
Yes.
Displacement can occur during a confirmed breakout, trend continuation, a failed retest, or the release of consolidation.
A sweep is common, but not mandatory.
What Is the Difference Between Displacement and Volatility?
Volatility describes how much or how quickly price moved.
Displacement describes whether the move changed structure and established acceptance in a new price area.
What Is the Difference Between Displacement and Impulse?
StructFirst uses displacement for the initial repricing event that changes or confirms structure.
Impulse continuation describes the sustained directional expansion that extends the accepted repricing.
Other trading frameworks may use the terms interchangeably.
Does Displacement Confirm Trend Reversal?
Not automatically.
Displacement may confirm a lower-timeframe correction, a continuation move, or an internal structural shift without reversing the higher-timeframe trend.
Is a Wick Through Structure Enough?
Usually not.
A wick may represent liquidity collection without acceptance.
Candle-body closes, follow-through, and retest behavior provide stronger evidence.
How Many Candles Can Form a Displacement Leg?
There is no fixed number.
Displacement may occur through one exceptional candle or a sequence of expanding candles with reduced overlap and clear structural effect.
Can Displacement Fail?
Yes.
A move may break structure, form an FVG, and still fail if price immediately reclaims the broken area or cannot maintain directional acceptance.
Should I Enter Immediately After Displacement?
Not automatically.
Entering immediately may offer better reward-to-risk but less confirmation.
Waiting for a retest, FVG response, protected swing, or BOS may provide more evidence but create a later entry.
Which Timeframe Is Best for Reading Displacement?
The timeframe should match the trading decision.
Higher timeframes provide structural context.
Lower timeframes can refine execution.
A lower-timeframe displacement should not automatically override higher-timeframe structure.
Does an FVG Need to Be Fully Filled?
No.
Price may react at the edge, midpoint, displacement origin, adjacent structure, or before reaching the imbalance.
The response matters more than a precise full fill.
How Do I Identify the Displacement Origin?
The origin is generally the area from which aggressive repricing began.
It may include:
- the last opposing candle,
- a consolidation base,
- a reclaimed liquidity level,
- the beginning of the expansion leg,
- or the FVG closest to the structural shift.
The correct origin depends on the logic and timeframe of the setup.
What Invalidates a Displacement Setup?
Invalidation may include:
- immediate reclaim of broken structure,
- acceptance back through the displacement origin,
- failure of the protected swing,
- opposing displacement,
- or failure to continue after the retest.
Invalidation should be defined before entry.
Conclusion: Displacement Is About Consequence
The greatest mistake in reading displacement is believing that strength can be measured from candle size alone.
It cannot.
A large candle may represent:
- volatility,
- liquidation,
- short covering,
- thin liquidity,
- a failed breakout,
- or genuine repricing.
The market must reveal which interpretation is correct.
A higher-quality displacement event usually develops through a sequence:
Meaningful Location
→ Liquidity Interaction
→ Aggressive Expansion
→ Structural Consequence
→ Acceptance
→ Follow-Through
A strong candle may begin that sequence.
It does not complete it.
The trader must evaluate:
- where the move began,
- what liquidity was involved,
- how efficiently price moved,
- which structure was affected,
- whether the new price area was accepted,
- and whether the market continued toward its next objective.
The same logic applies to Fair Value Gaps.
An FVG is not valuable simply because three candles created an imbalance.
It becomes more meaningful when it was formed by displacement that changed structure and established acceptance.
The same logic applies to volume.
High effort does not confirm control unless price produces a meaningful result.
The same logic applies to BOS, CHoCH, and MSS.
A label becomes stronger when displacement demonstrates that the market did more than cross a line—it repriced through the structure and held the change.
Markets do not reprice because a candle is large.
A candle becomes meaningful when it reveals that liquidity has changed hands, structure has been altered, and the new price area is being accepted.
The complete StructFirst sequence remains:
Structure
→ Location
→ Liquidity
→ Displacement
→ Confirmation
→ Failure Logic
→ Execution
→ Risk
And the central lesson is simple:
Do not trade the size of the candle. Trade the structural consequence of the move.
Continue Building Your Structural Framework
Displacement becomes far more useful when it is connected to the broader process that gives price movement meaning.
Begin with Why Market Structure Comes First: The StructFirst Trading Framework to understand why directional prediction must remain secondary to higher-timeframe context.
Continue with How to Read Candlesticks: Liquidity, Volume, and Market Structure to examine how candle bodies, wicks, volume, and acceptance reveal the quality of a price response.
Then read What Is a Liquidity Sweep? Confirmation, Failure, and Execution to understand why a sweep creates the event but does not confirm reversal.
Finally, connect displacement to structural confirmation through BOS vs CHoCH vs Market Structure Shift: What Actually Confirms a Trend Change?, where BOS, CHoCH, and MSS are evaluated through liquidity, repricing, acceptance, and failure logic.
Next, use What Are Protected Highs and Lows in Trading? Which Swing Actually Invalidates the Trade? to identify which structural swing the displacement leg must preserve after repricing.
Then connect the move to What Are Acceptance and Rejection in Trading? Why One Wick or Close Is Not Enough to determine whether the market actually accepted the new price area or merely produced a temporary reaction.
Leave a Reply