StructFirst Core Guide #006
A chart can display dozens of valid BOS and CHoCH signals while the larger trend remains unchanged.
A five-minute bullish Break of Structure can form inside a four-hour bearish retracement.
A fifteen-minute bearish Change of Character can appear during an ordinary pullback inside a Daily uptrend.
Price can rotate bullishly and bearishly several times inside the same higher-timeframe trading range without producing a genuine trend reversal.
The labels may be technically correct.
The trade interpretation may still be wrong.
This is the practical problem behind internal vs external market structure.
The question is not simply:
Did price print BOS or CHoCH?
The more useful questions are:
Which swing was broken? Which timeframe does that swing belong to? Did the break change the controlling auction, or did it only change the local delivery?
Internal market structure describes the smaller sequences developing inside a larger trend leg, range, or higher-timeframe move.
External market structure describes the major highs, lows, protected swings, and range boundaries that control the broader auction.
Both are necessary.
They perform different jobs.
External structure defines directional control. Internal structure refines timing, execution, invalidation, and trade management.
This distinction extends the hierarchy introduced in Why Market Structure Comes First: The StructFirst Trading Framework. Higher-timeframe structure defines the environment. Lower-timeframe structure provides evidence inside that environment.
The StructFirst sequence for this guide is:
Higher-Timeframe External Structure
→ External Liquidity
→ Internal Price Delivery
→ Displacement
→ Internal Confirmation
→ External Structural Change
→ Execution
→ Invalidation
→ Target Liquidity
The purpose is not to label every swing.
The purpose is to identify which structure controls the trade and which structure merely improves the entry.
Why Structural Hierarchy Matters in Real Trading
The same chart can look bullish, bearish, or neutral depending on the timeframe selected.
That does not mean one timeframe is correct and the others are wrong.
Each timeframe may be describing a different layer of the auction.
A four-hour chart may show price retracing within a bearish range.
A fifteen-minute chart may show a clean bullish sequence during that retracement.
A five-minute chart may then print a bearish CHoCH inside the fifteen-minute advance.
All three observations can be valid at the same time.
The problem begins when the trader fails to assign each observation a role.
Without hierarchy, the trader may:
- change bias after every lower-timeframe CHoCH,
- treat a minor BOS as a major trend reversal,
- enter directly into opposing higher-timeframe liquidity,
- use a wide higher-timeframe stop for a poor lower-timeframe entry,
- or abandon a valid higher-timeframe thesis because one internal trade failed.
The lower timeframe offers precision.
The higher timeframe defines the structural burden that price must overcome.
Precision does not equal control.
A lower-timeframe signal can be more precise while remaining subordinate to a higher-timeframe structure.
What Is Internal Market Structure?
Internal market structure consists of the smaller swings that form inside a broader directional move or trading range.
These can include:
- minor higher highs and higher lows,
- minor lower highs and lower lows,
- intraday BOS and CHoCH events,
- session rotations,
- corrective legs,
- inducement highs and lows,
- internal liquidity pools,
- and execution-timeframe protected swings.
Internal structure helps answer:
How is price currently moving inside the larger auction?
It can show whether price is:
- advancing efficiently,
- retracing,
- compressing,
- losing short-term momentum,
- recovering after a liquidity sweep,
- or approaching an external boundary.
Internal structure is highly useful for execution.
It can help the trader:
- confirm a liquidity response,
- identify displacement,
- wait for an efficient retracement,
- define a tighter invalidation,
- manage partial profits,
- or recognize that short-term order flow has failed.
However, internal structure does not automatically answer:
Has the larger trend reversed?
A five-minute protected low may be critical to a five-minute long position while remaining irrelevant to the four-hour trend.
A fifteen-minute BOS may validate an intraday long while price is still moving toward higher-timeframe resistance.
Internal structure is not unimportant.
Its importance is conditional on the trade being planned.
What Is External Market Structure?
External market structure consists of the major highs, lows, and boundaries that define the controlling auction.
These often include:
- major swing highs and lows,
- higher-timeframe protected highs and lows,
- range support and resistance,
- previous expansion origins,
- major accumulation or distribution boundaries,
- and external liquidity visible across several timeframes.
External structure helps answer:
What level must fail before the larger directional condition materially changes?
In a bullish external structure, several internal bearish rotations can form while the major protected low remains intact.
In a bearish external structure, several internal bullish sequences can develop while the protected high remains unbroken.
Inside a range, the external boundaries control the auction even while price produces numerous bullish and bearish internal shifts around equilibrium.
External structure changes less frequently than internal structure.
That is why it should carry greater weight when defining directional bias, thesis invalidation, and major target liquidity.
Internal structure describes local delivery. External structure defines the larger condition in which that delivery occurs.
One External Range, Many Internal Changes
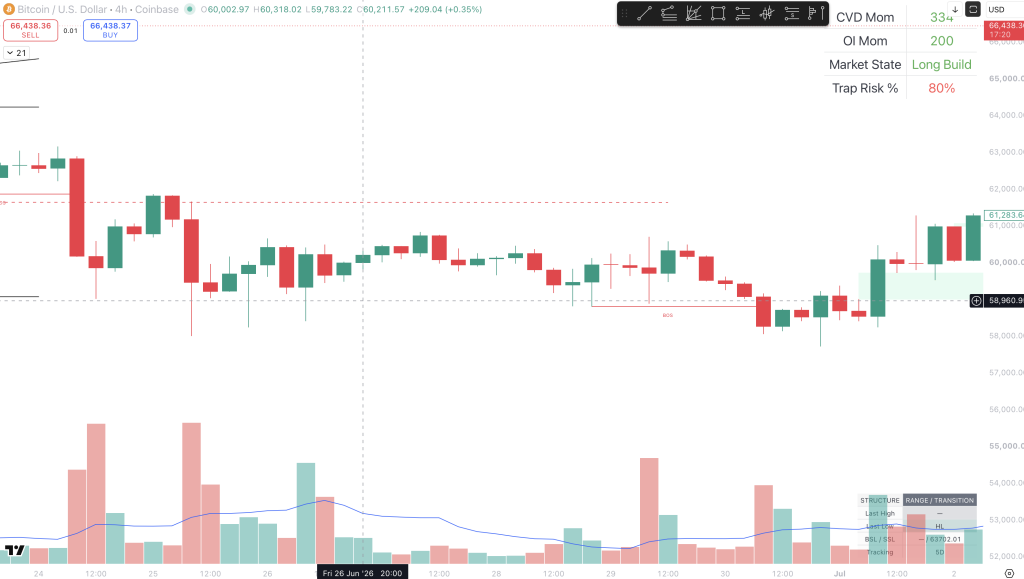
The four-hour chart shows a broad external structure.
At this level, the trader should focus on:
- the major range high,
- the major range low,
- the protected swing controlling the active side,
- and the next external liquidity pool.
A local BOS near the lower portion of the range may matter for short-term delivery.
It does not independently resolve the higher-timeframe range.
Price can move above or below several internal levels while remaining structurally contained by the same external boundaries.
The larger state remains unresolved until price produces one of two meaningful outcomes:
- Breakout and acceptance beyond the external boundary, or
- Liquidity sweep and rejection followed by displacement back through meaningful structure.
A wick outside the range is not enough.
A lower-timeframe label is not enough.
External resolution requires consequence.
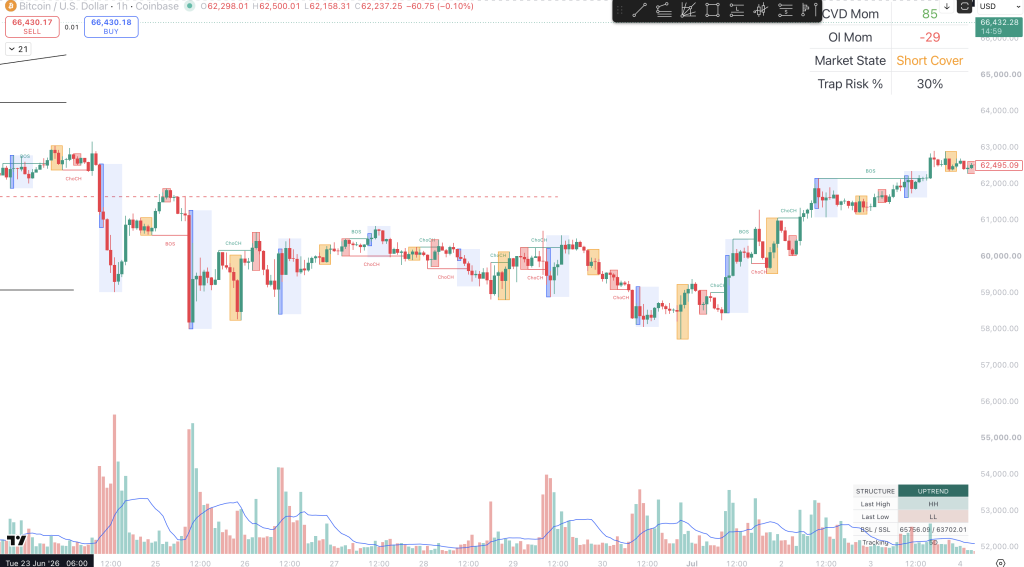
The one-hour view contains far more information.
Numerous BOS and CHoCH labels appear as price rotates through smaller swings.
Some of those signals may have provided valid intraday trades.
They did not all change the higher-timeframe condition.
This creates a key distinction:
A structural signal can be valid for execution without being valid as a higher-timeframe trend reversal.
The one-hour bullish shifts may represent:
- short covering,
- movement toward range resistance,
- rebalancing of an imbalance,
- or temporary recovery inside a broader range.
The bearish shifts may represent:
- profit-taking,
- movement toward internal liquidity,
- or local weakness without external breakdown.
The labels describe local behavior.
The four-hour boundaries still define the larger auction.
Practical Trading Lesson
When lower-timeframe labels alternate repeatedly, stop changing directional bias with every signal.
Return to the controlling chart and ask:
- Has external liquidity been reached?
- Has the protected external swing failed?
- Has price accepted beyond the range?
- Is the market still trading around equilibrium?
When the answers remain unclear, the market may be providing internal trades without offering an external trend decision.
Protected Swings vs Minor Pivots
Not every swing high or low deserves equal structural weight.
A minor pivot is a local turning point.
A protected swing is the high or low whose failure would materially weaken the active directional sequence.
In a bullish market, the protected low usually supports the move that broke meaningful resistance.
In a bearish market, the protected high usually supports the move that broke meaningful support.
The exact swing may vary with timeframe.
The principle remains consistent:
A swing becomes important because of the structural consequence it supports—not merely because price turned there.
Suppose price is bullish on the one-hour chart.
During the advance, price forms three small higher lows.
Breaking the most recent minor low may produce an internal bearish CHoCH.
Breaking the deeper low that originated the move through major resistance may create a far more meaningful structural change.
The first break may trigger trade management.
The second may invalidate the broader bullish thesis.
Before changing bias, ask:
- Was the broken level a minor pivot or the protected swing?
- Did the break occur with displacement?
- Did candle bodies close beyond it?
- Did price remain beyond the level?
- Did the retest confirm acceptance?
- Was external liquidity involved?
These questions connect directly to BOS vs CHoCH vs Market Structure Shift: What Actually Confirms a Trend Change?, where structural labels are evaluated through liquidity, displacement, acceptance, and failure logic rather than through line breaks alone.
The distinction between a minor pivot and the swing that actually protects the directional thesis is developed in What Are Protected Highs and Lows in Trading? Which Swing Actually Invalidates the Trade?.
Lower-Timeframe Bullish Structure Can Exist Inside a Bearish Market
One of the most useful real-trading lessons is that opposite structural conditions can exist simultaneously.
A fifteen-minute chart can be bullish.
The four-hour chart can remain bearish.
Both observations may be correct.
The fifteen-minute rally may represent:
- a corrective move,
- short covering,
- a retracement into premium,
- a return toward a bearish FVG,
- a retest of broken support,
- or internal liquidity delivery before the higher-timeframe decline resumes.
The rally can still be tradable.
But it should not automatically be called a higher-timeframe reversal.
Internal Bullishness Inside External Bearish Control
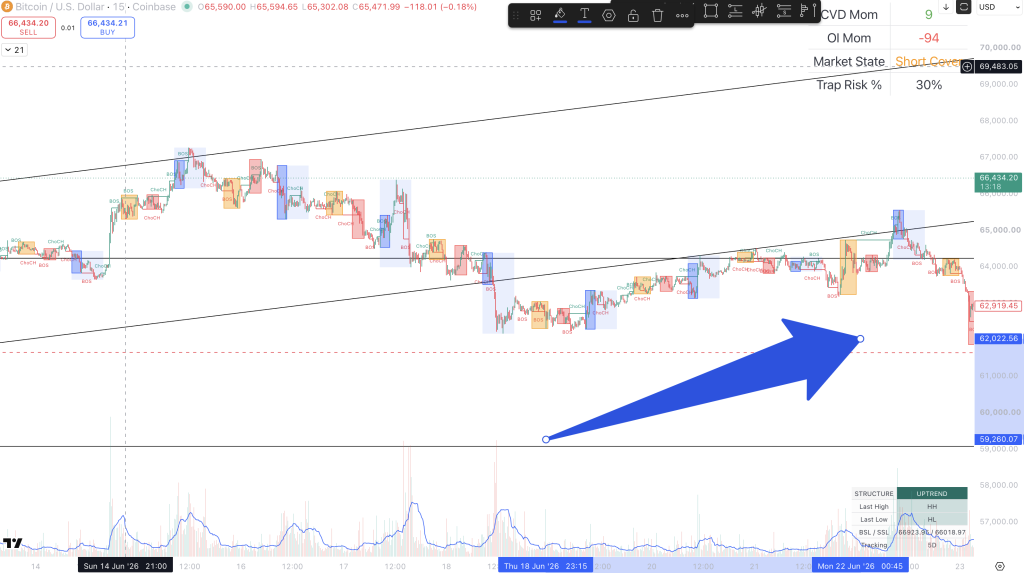
The fifteen-minute chart shows repeated local changes.
Price forms bullish internal sequences, breaks nearby highs, and offers short-term upside movement.
From this timeframe alone, the market can appear bullish.
That observation may support:
- an intraday long,
- a scalp toward internal buy-side liquidity,
- or a short-covering trade.
It should not automatically support:
- a four-hour bullish reversal,
- a swing trade through major resistance,
- or the assumption that all bearish structure has failed.
The trade must remain proportional to the structural layer that confirmed it.
An internal long should first target internal liquidity unless external structure also confirms continuation.
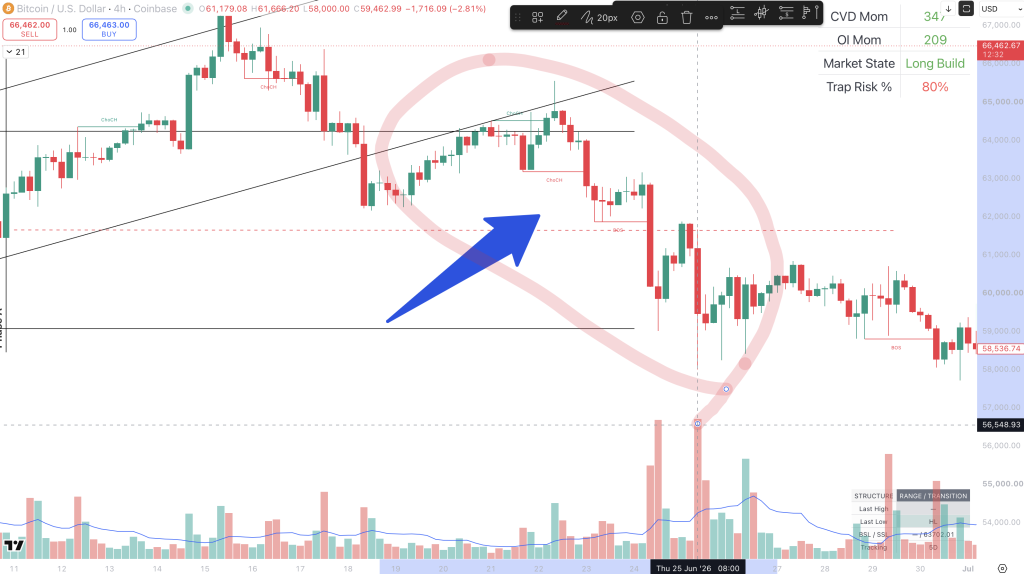
The four-hour view changes the interpretation.
The lower-timeframe bullish sequence appears as a retracement inside a larger bearish structure.
Price rallies toward resistance but does not establish sustained higher-timeframe acceptance.
The broader market later resumes lower.
The lower-timeframe bullish signals were not necessarily false.
They were subordinate.
This produces an important execution rule:
A lower-timeframe reversal can become a higher-timeframe retracement.
A countertrend long may still be professional when:
- the external downside objective has already been reached,
- lower-timeframe liquidity has been swept,
- bullish displacement confirms a reaction,
- the target is limited to internal or higher-timeframe resistance,
- and invalidation is defined tightly.
The error is not taking the countertrend trade.
The error is treating a countertrend trade as proof that the controlling structure has reversed.
This same distinction appears in Bitcoin 4H Resistance Zone: Liquidity, Confirmation, and Invalidation, where lower-timeframe price action required interpretation inside a larger resistance problem.
The Three Professional Uses of Internal Structure
Internal structure is most useful in three areas.
1. Early Warning
An internal CHoCH can warn that the current move is weakening.
That warning may justify:
- reducing risk,
- taking partial profit,
- stopping new entries,
- or monitoring the deeper protected swing.
An early warning is not the same as an external reversal.
2. Execution Confirmation
Once a higher-timeframe location and liquidity event are established, internal structure can confirm whether the location is becoming executable.
Useful evidence may include:
- displacement,
- internal CHoCH or MSS,
- a meaningful BOS,
- FVG creation,
- a successful retest,
- and formation of a protected execution swing.
The previous guide, What Is Displacement in Trading? Why Strong Candles Alone Are Not Enough, explains why an internal break becomes more meaningful when price aggressively reprices through structure and holds the result.
3. Position Management
Internal structure can help manage an existing position.
A trader can use it to identify:
- partial-profit locations,
- weakening follow-through,
- an opposing liquidity response,
- a trailing protected swing,
- or the failure of the current execution model.
These uses respect hierarchy.
Internal structure supports the trade.
It does not create a higher-timeframe thesis that the chart has not earned.
External Liquidity Creates the Structural Test
External highs and lows often contain significant liquidity.
Buy-side liquidity may rest above:
- major swing highs,
- equal highs,
- prior-day or prior-week highs,
- range resistance,
- or a protected bearish high.
Sell-side liquidity may rest below:
- major swing lows,
- equal lows,
- prior-day or prior-week lows,
- range support,
- or a protected bullish low.
When price reaches external liquidity, the trader should not predict the result in advance.
Three broad outcomes remain possible:
- Reversal
- Continuation
- Breakout and acceptance
The liquidity event creates the test.
The response determines the meaning.
As explained in What Is a Liquidity Sweep? Confirmation, Failure, and Execution, a sweep confirms only that price traded into an identifiable order pool. It does not prove that the market will reverse.
A higher-quality reversal sequence often requires:
External Liquidity
→ Sweep
→ Reclaim or Rejection
→ Displacement
→ Internal Structure Shift
→ Retest
→ Acceptance
→ Continuation
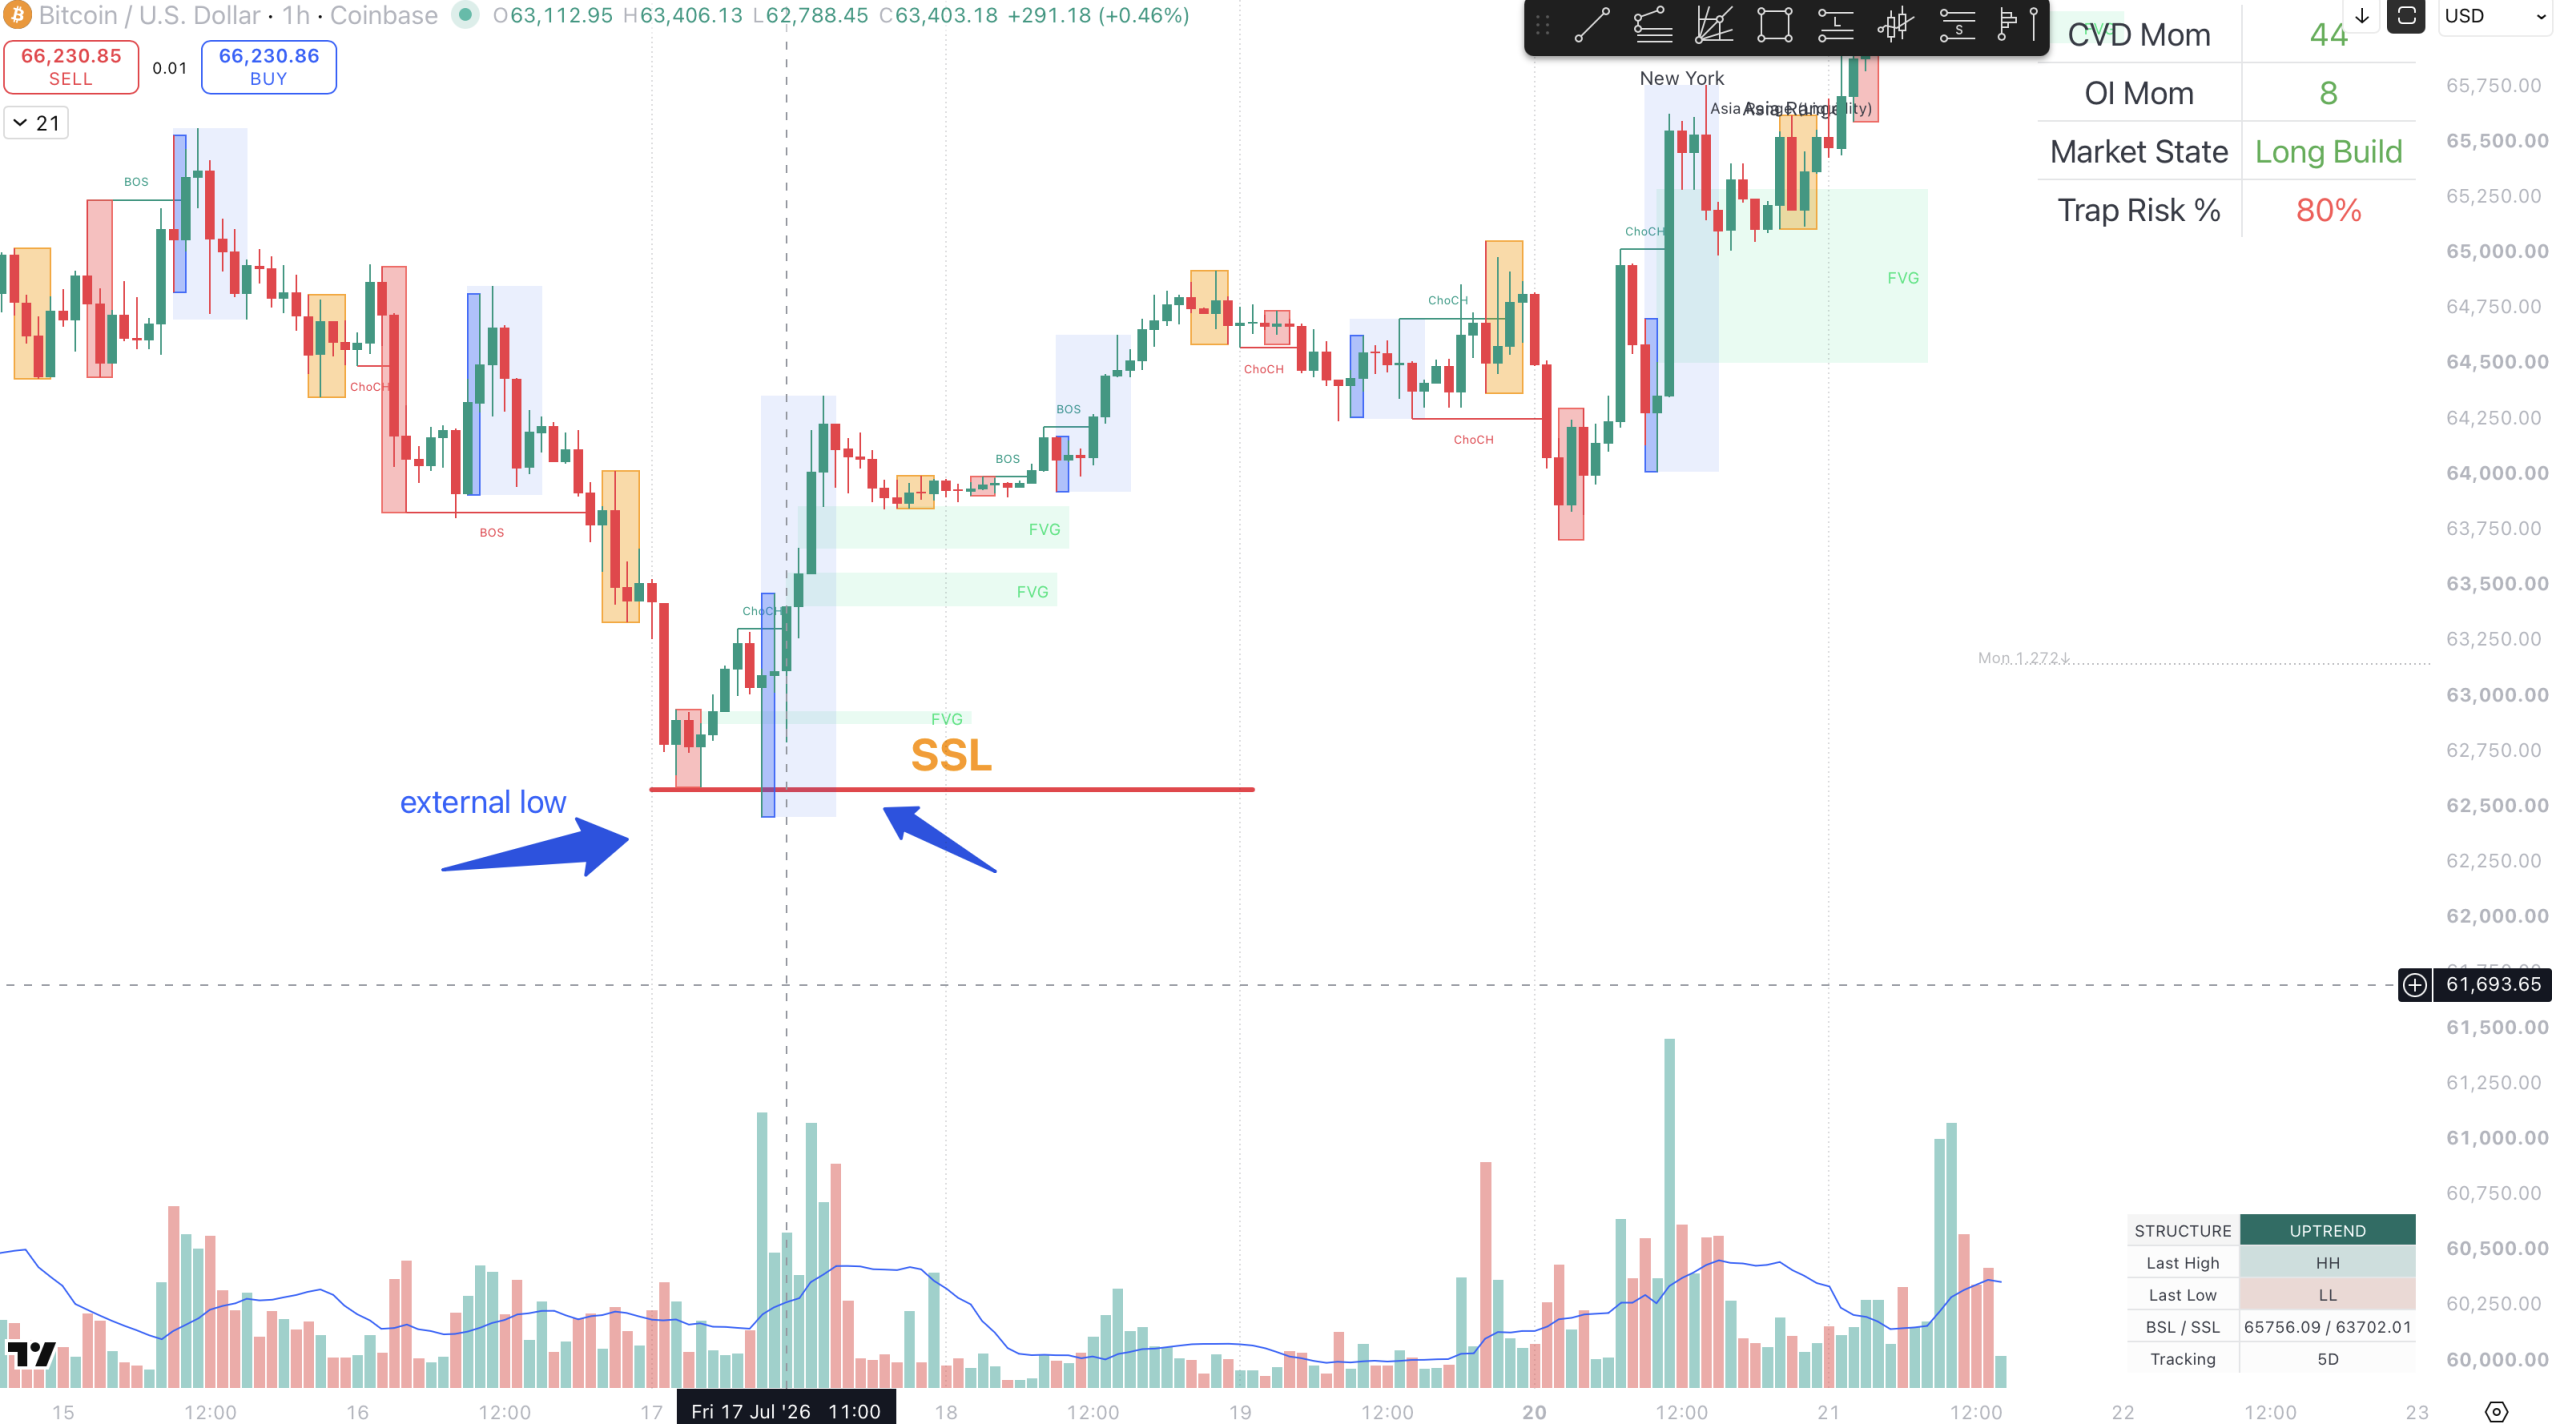
External Low Sweep to Accepted Repricing
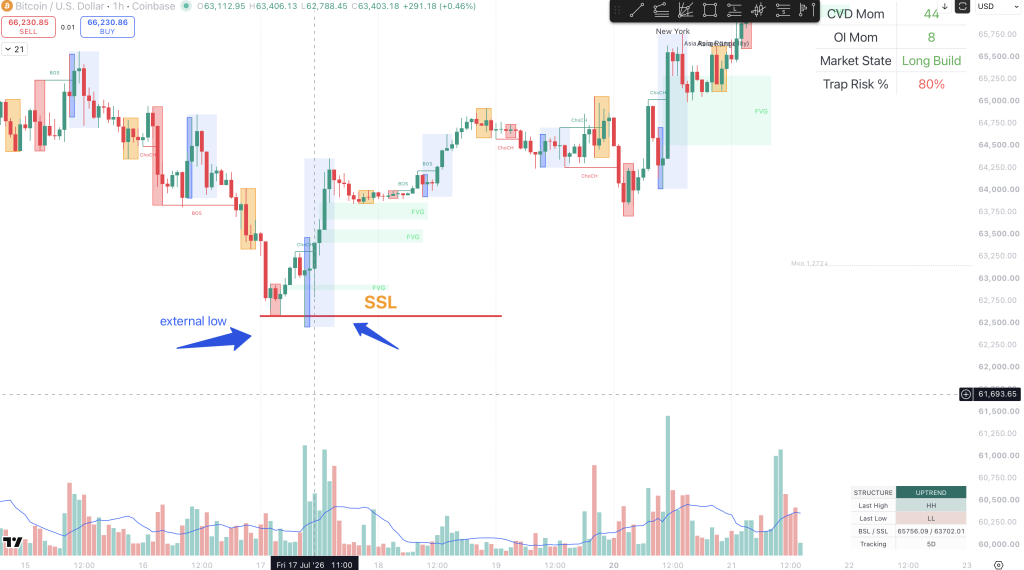
The marked low is an external reference within the one-hour structure.
Sell-side liquidity rests beneath it.
Price trading below the low creates a liquidity event.
At that moment, price can still:
- continue lower,
- reclaim the level and reverse,
- or remain in an unresolved range.
The sweep does not confirm the long.
The first task is to observe whether lower prices are accepted.
If candle bodies begin closing below the low and failed retests develop beneath it, the breakdown may be genuine.
If price reclaims the low, displaces higher, and breaks meaningful internal resistance, the sweep may become a reversal event.
External structure defines where the decision matters. Internal structure reveals how the market responds.
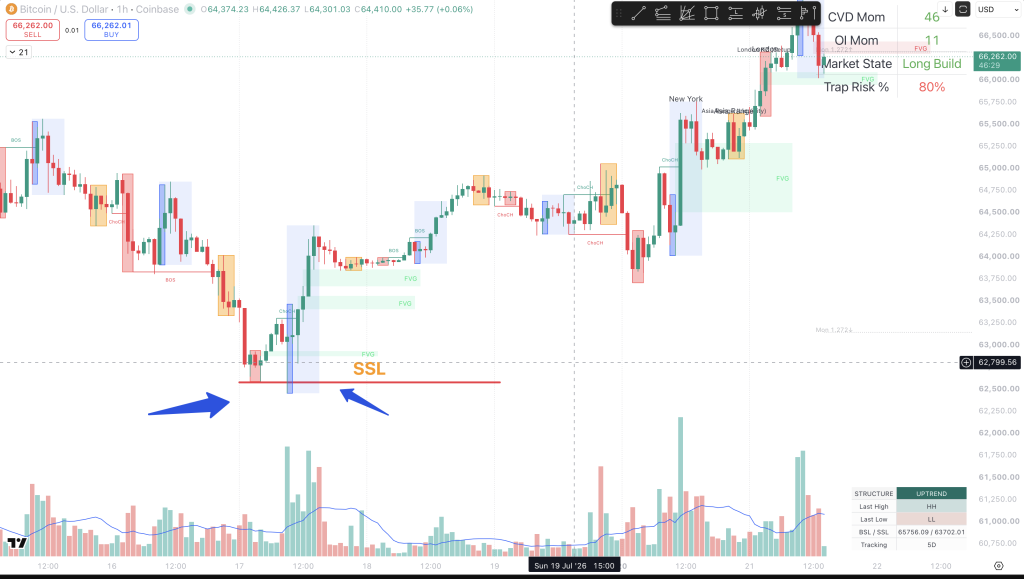
The expanded chart shows what happened next.
During the transition into the New York session, price reclaimed the liquidity area and produced bullish displacement.
The response included:
- expanding bullish candle bodies,
- reduced overlap,
- a meaningful internal CHoCH,
- BOS,
- FVG formation,
- and continued acceptance at higher prices.
The sequence was:
External Sell-Side Liquidity
→ Sweep
→ Reclaim
→ Bullish Displacement
→ Internal CHoCH
→ BOS
→ Acceptance
→ Upside Continuation
The important point is not that a CHoCH label appeared.
The important point is that the internal structure changed after an external liquidity event and that the change was sustained.
Confirmed Observation
- Price traded beneath the external low.
- Price reclaimed the level.
- Bullish displacement broke internal structure.
- Price continued to form value at higher prices.
Structural Inference
The failure to accept below the external low suggests that sellers lost control of the immediate auction.
Unconfirmed Possibility at the Time of the Sweep
The sweep could have become a bullish reversal, but confirmation was still absent until displacement and internal structure changed.
This distinction prevents early entries based only on a wick.
A related session execution example appears in BTC 30M: The London Session Liquidity Sweep and ICT Turtle Soup, where a lower-timeframe trade remained subordinate to the broader structural context.
When Does Internal Structure Become an External Change?
Internal structure does not become external merely because several BOS labels appear.
The transition requires meaningful structural consequence.
A lower-timeframe shift becomes capable of changing the larger trend when several conditions align.
External Liquidity Has Been Reached
Price interacts with a major high, low, or range boundary.
Displacement Occurs
Price reprices aggressively through a meaningful swing rather than drifting through a minor pivot.
The Protected Swing Fails
The swing maintaining the prior higher-timeframe sequence is broken.
Candle Bodies Establish Acceptance
Price does not merely wick through the structure.
It closes beyond it and remains beyond it.
The importance of body closes, wick behavior, volume, and acceptance is explained in Candlestick Footprints: Reading Institutional Intent.
The Retest Holds
Former resistance becomes support, or former support becomes resistance.
Follow-Through Develops
Price continues toward the next external liquidity pool.
A practical transition may appear as:
Internal CHoCH
→ Displacement
→ Protected Swing Break
→ Retest
→ External BOS
→ Acceptance
→ New External Objective
Not every market produces a perfect textbook sequence.
The logic matters more than the label order.
Trading Ranges Require a Different Structural Reading
Inside a trend, external structure is often defined by protected swing highs and lows.
Inside a trading range, external structure is usually defined by the range boundaries.
The center of the range contains internal movement.
The edges contain the major structural tests.
This is why the middle of a range frequently produces poor trades.
Price can print repeated BOS and CHoCH signals around equilibrium while neither side has established external control.
The trader faces:
- unclear directional asymmetry,
- unfinished liquidity above and below,
- frequent false breaks,
- and difficult invalidation.
At the lower range boundary, monitor whether price:
- accepts below support,
- sweeps liquidity and reclaims,
- forms a Spring candidate,
- or produces a genuine Sign of Weakness.
At the upper boundary, monitor whether price:
- accepts above resistance,
- sweeps buy-side liquidity and rejects,
- forms an Upthrust or UTAD candidate,
- or produces a confirmed Sign of Strength.
External Wyckoff Range and Structural Transition
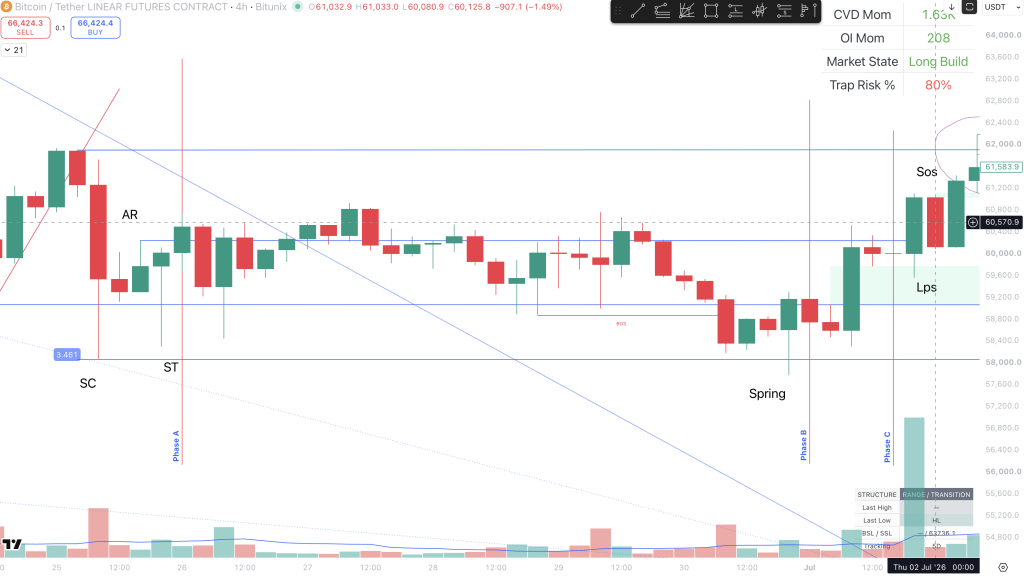
The four-hour chart presents a potential Wyckoff accumulation sequence containing:
- Selling Climax,
- Automatic Rally,
- Secondary Test,
- Spring,
- Last Point of Support,
- and Sign of Strength.
These labels should remain conditional.
The chart should produce the label.
The label should not force the interpretation.
The primary structural information is the external range.
The Spring becomes meaningful because price:
- trades beneath the lower range boundary,
- fails to maintain acceptance below it,
- reclaims the range,
- develops bullish internal structure,
- holds the later pullback,
- and progresses toward upper liquidity.
The LPS is not bullish merely because the label appears.
It becomes relevant when the pullback holds after the reclaim and preserves the bullish structure.
The SOS becomes relevant when price produces actual progress toward the upper range boundary.
The complete sequence is:
External Sell-Side Liquidity
→ Failed Acceptance Below the Range
→ Reclaim
→ Internal Bullish Shift
→ LPS
→ SOS
→ Acceptance Higher
This chart can be compared with Bitcoin Wyckoff Redistribution: How the 6H Structure Confirmed Markdown, where internal weakness ultimately resolved the external range in the opposite direction.
The Spring itself remains only a candidate until price reclaims the active range and produces sufficient structural consequence. For the complete range-based confirmation model, read What Is a Wyckoff Spring in Trading? Why a Sweep Below Support Is Not Enough.
Similar Internal Labels Can Produce Opposite Outcomes
A bullish BOS is not equally bullish in every location.
A bearish CHoCH is not equally bearish in every range.
The label describes the direction of the local break.
The external context determines the trade meaning.
A bullish BOS inside a weakness-oriented range may represent:
- short covering,
- an internal rotation,
- inducement,
- or delivery toward external buy-side liquidity.
A bullish BOS after a confirmed Spring may represent:
- recovery from external sell-side liquidity,
- a meaningful internal shift,
- a Sign of Strength,
- or the beginning of external range resolution.
The label may look similar.
The location, liquidity event, displacement, and acceptance are different.
Similar Labels, Different External Context
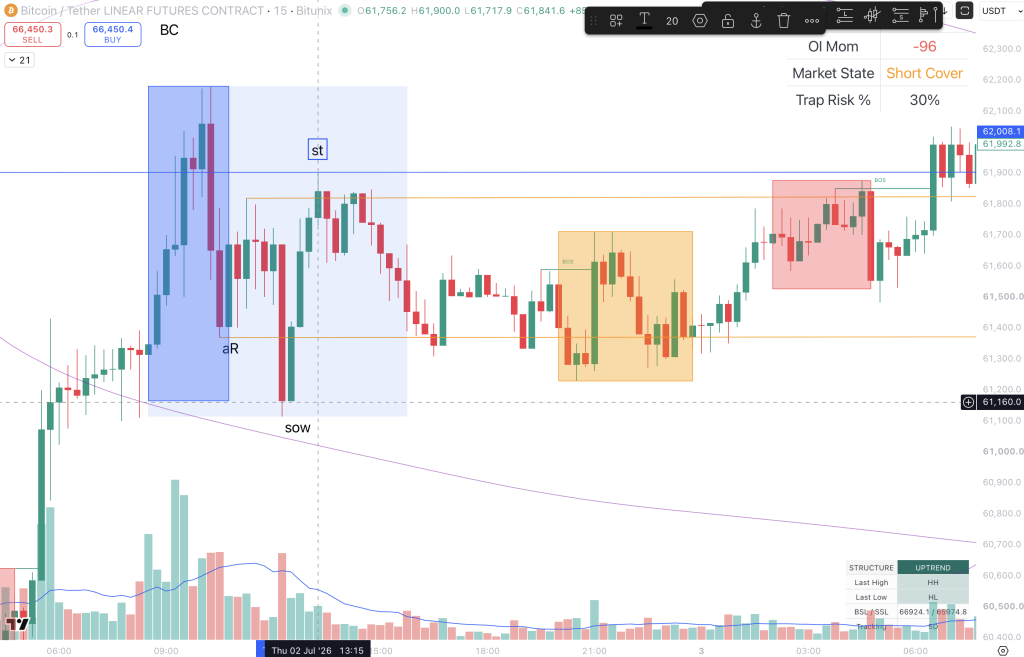
Several internal labels suggest local weakness.
However, the market later accepts above the upper range boundary.
This is an important failure-logic example.
A Sign of Weakness label does not guarantee markdown.
A Buying Climax label does not guarantee distribution.
The weakness hypothesis should remain conditional until price confirms:
- failure to reclaim the range,
- sustained acceptance below support,
- bearish displacement,
- and continuation toward sell-side liquidity.
When price instead establishes acceptance above the upper range, the earlier bearish interpretation must be reconsidered.
A valid label can belong to an invalidated thesis.
The trader must respond to the current market structure, not defend the previous label.
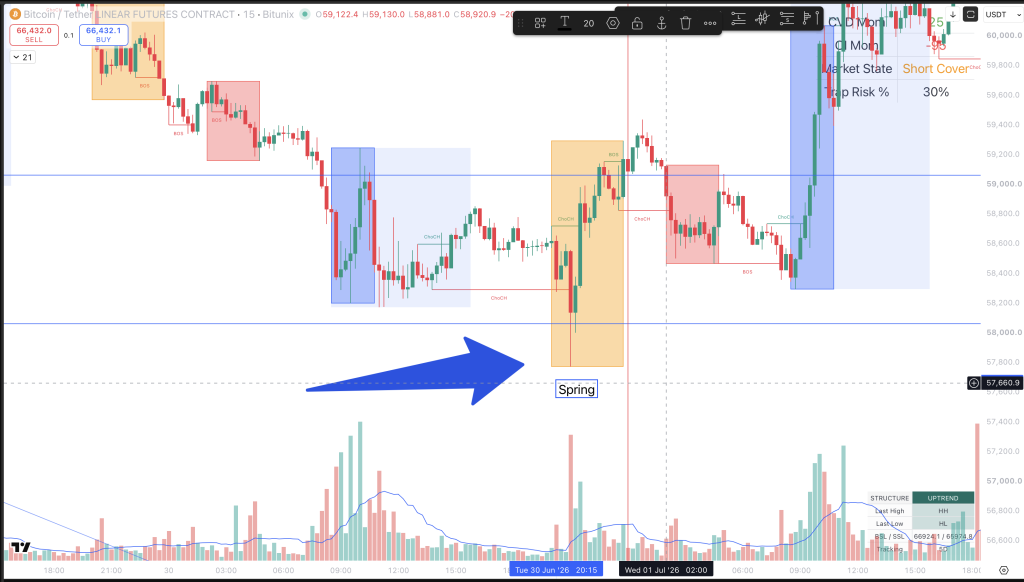
The second chart shows a different sequence.
Price trades below range support in a Spring candidate.
The sweep alone is not enough.
Confirmation develops when price:
- reclaims the range,
- produces bullish displacement,
- breaks meaningful internal structure,
- holds the recovery,
- and continues toward higher liquidity.
Here, the bullish internal BOS carries greater execution value because it follows an external liquidity event and a confirmed reclaim.
The difference is:
Unresolved Weakness Hypothesis
Internal bearish labels
→ No sustained external breakdown
→ Upper boundary eventually reclaimed
→ Bearish thesis invalidated
Spring and Recovery
External liquidity sweep
→ Reclaim
→ Bullish displacement
→ Internal CHoCH and BOS
→ Acceptance
→ Upside continuation
Internal structure does not define the narrative by itself. Its meaning comes from the external location and the market’s response to that location.
The earlier Bitcoin 12H Wyckoff Accumulation Structure documented the same professional requirement: accumulation remained only a hypothesis until the lower boundary produced a confirmed liquidity event and structural recovery.
Internal vs External Market Structure Comparison
| Internal Market Structure | External Market Structure |
|---|---|
| Smaller swings inside a larger move | Major swings and range boundaries |
| Changes frequently | Changes less frequently |
| Useful for execution timing | Defines directional control |
| Contains internal liquidity | Contains major external liquidity |
| May produce many BOS and CHoCH signals | Requires meaningful structural consequence |
| Helps define tight invalidation | Defines broader thesis invalidation |
| Can reverse while the higher timeframe remains unchanged | Changes when protected structure fails and acceptance develops |
| Supports position management | Defines major target liquidity |
| Can be tradable countertrend | Determines whether the larger trend is intact |
The two layers should work together.
External structure without lower-timeframe confirmation can produce late entries or excessive risk.
Internal structure without external context can produce repeated false bias changes.
A Practical Multi-Timeframe Workflow
Before opening a trade, move through the chart in this order.
1. Define the Controlling Timeframe
The controlling timeframe should match the trade duration.
A swing trade may use:
Daily → 4H → 1H → 15M
An intraday trade may use:
4H → 1H → 15M → 5M
The exact combination can change.
The hierarchy should not.
2. Mark External Structure First
Identify:
- the external high,
- the external low,
- the active range boundaries,
- the protected swing,
- and the next external liquidity target.
Do this before reading lower-timeframe labels.
3. Identify the Current Internal Delivery
Determine whether the lower timeframe is:
- aligned with the higher timeframe,
- correcting against it,
- compressing toward liquidity,
- or transitioning after a sweep.
4. Wait for the Liquidity Event
Avoid entering in anticipation simply because price is close to an external level.
Allow price to test the level.
5. Demand Displacement and Structural Consequence
A sweep should be followed by evidence.
Look for:
- strong body expansion,
- reduced overlap,
- a meaningful internal swing break,
- FVG formation when present,
- and failure to return immediately to the origin.
6. Separate Entry Invalidation From Thesis Invalidation
The lower-timeframe entry may fail while the higher-timeframe idea remains valid.
Define both levels in advance.
7. Target Liquidity in Layers
The first target may be internal liquidity.
The primary target may be external liquidity.
Partial profit can be taken at the internal objective while a smaller position remains for the larger target.
Once the controlling external range has been identified, Premium and Discount can describe relative location inside that range. The midpoint itself is not an entry signal; location still requires liquidity, confirmation, and defined invalidation. For the complete framework, read What Are Premium and Discount in Trading? Why the 50% Level Is Not a Buy or Sell Signal.
Bullish Execution Model
A higher-quality bullish setup may develop as:
Higher-Timeframe Discount
→ External Sell-Side Liquidity
→ Sweep or Failed Breakdown
→ Reclaim
→ Bullish Displacement
→ Internal CHoCH or MSS
→ Internal BOS
→ Retest
→ Execution
→ External Buy-Side Liquidity
Entry Condition
Do not enter simply because price trades below the external low.
Wait for:
- reclaim,
- bullish displacement,
- a meaningful internal swing break,
- and a location where invalidation can be defined efficiently.
Invalidation
Entry invalidation may sit below:
- the protected execution low,
- the displacement origin,
- or the reclaimed structure.
Broader thesis invalidation may remain below the external low or range boundary.
These are not always the same price.
Targets
Potential targets include:
- internal buy-side liquidity,
- a session high,
- range equilibrium,
- the external range high,
- or a major higher-timeframe high.
Bearish Execution Model
A higher-quality bearish setup may develop as:
Higher-Timeframe Premium
→ External Buy-Side Liquidity
→ Sweep or Failed Breakout
→ Bearish Displacement
→ Internal CHoCH or MSS
→ Internal BOS
→ Failed Retest
→ Execution
→ External Sell-Side Liquidity
Entry Condition
Do not short automatically when price trades above an external high.
A breakout can continue.
Wait for:
- failed acceptance,
- bearish displacement,
- a break of meaningful internal support,
- and a failed reclaim.
Invalidation
Entry invalidation may sit above:
- the protected lower-timeframe high,
- the displacement origin,
- or the failed retest.
Broader thesis invalidation may require sustained acceptance above the external high.
The difference matters.
A practical higher-timeframe-to-lower-timeframe short model appears in UTAD Short Setup: Structural Trading and Trap Execution, where the sweep did not create the trade; lower-timeframe displacement and structural failure did.
Targets
Potential targets include:
- internal lows,
- range equilibrium,
- the external range low,
- or a larger sell-side liquidity objective.
Invalidation Must Match the Structural Layer
One of the most common risk-management mistakes is mixing structural layers.
A trader enters from a five-minute signal and uses a Daily invalidation.
The stop becomes unnecessarily large.
Another trader forms a four-hour thesis but exits because of one minor five-minute CHoCH.
The thesis is abandoned because of internal noise.
The correct process separates two questions.
What Invalidates the Entry?
The entry may fail if:
- the protected lower-timeframe swing breaks,
- the retest fails,
- the displacement origin is lost,
- or opposing displacement appears.
What Invalidates the Broader Thesis?
The broader thesis may fail if:
- the external protected swing breaks,
- price accepts beyond the range boundary,
- the original liquidity event resolves against the thesis,
- or the higher-timeframe auction materially changes.
A failed entry is not always a failed thesis.
That does not mean the trader should hold the failed entry.
Exit the invalid execution.
Reassess whether a new entry develops while the broader thesis remains valid.
Never use a broad thesis to defend a poor entry. Never use minor internal noise to invalidate a structure that remains intact.
Failure Logic
A bullish internal shift begins to fail when:
- price cannot hold above broken internal structure,
- the displacement is fully reclaimed,
- the protected execution low fails,
- or bullish follow-through disappears.
A bullish external shift begins to fail when:
- former external resistance cannot hold as support,
- price returns to the old range and accepts inside it,
- the higher-timeframe protected low fails,
- or the apparent breakout becomes a liquidity trap.
A bearish structure follows the opposite logic.
The trader must identify which layer is failing.
This distinction improves trade management because it prevents emotional attachment to one entry or one directional opinion.
Common Internal and External Structure Mistakes
Treating Every Swing as Equal
A minor pivot does not carry the same structural weight as a protected external swing.
Changing Bias With Every CHoCH
A CHoCH may identify a local correction without changing the higher-timeframe trend.
Ignoring the Controlling Timeframe
The execution timeframe should not automatically override the timeframe defining the trade.
Calling Every Range Break an External BOS
A wick outside a range may be a liquidity sweep. Acceptance is still required.
Confusing Internal Liquidity With the Final Target
A local high may be cleared while the important external high remains untouched.
Entering in the Middle of the Range
The center often provides weak asymmetry, unclear invalidation, and frequent internal reversals.
Treating Lower-Timeframe Bullishness as a Macro Reversal
Internal bullish structure may simply deliver price toward higher-timeframe premium.
Ignoring Displacement
A slow drift through a minor swing does not carry the same information as decisive repricing through protected structure.
Defending a Failed Entry With Higher-Timeframe Bias
A valid higher-timeframe idea does not make every lower-timeframe entry valid.
Abandoning the Higher-Timeframe Thesis After One Failed Entry
A lower-timeframe stop-out may not change the external structure.
Forcing Wyckoff Labels
A Spring, UTAD, SOW, or SOS must remain conditional until price confirms the sequence.
Ignoring No-Trade Conditions
Conflicting internal and external structure can be a professional reason to stay flat.
Real Trading Lesson: Opposite Timeframes Can Both Be Right
The higher timeframe may be bearish.
The lower timeframe may produce a valid bullish trade.
The bullish trade can reach its internal target while the broader bearish thesis remains intact.
This is not a contradiction.
It is a difference in structural role.
Four combinations are possible:
HTF Bullish, LTF Bullish
The directional environment and execution align.
HTF Bullish, LTF Bearish
Price may be retracing toward discount, support, or sell-side liquidity.
HTF Bearish, LTF Bearish
The directional environment and execution align.
HTF Bearish, LTF Bullish
Price may be correcting toward premium, resistance, or buy-side liquidity.
None of those combinations automatically creates a trade.
The market must still provide:
- meaningful location,
- liquidity interaction,
- confirmation,
- invalidation,
- and sufficient target distance.
The purpose of multi-timeframe analysis is not to force every chart into agreement.
It is to understand what role each chart is currently performing.
The higher timeframe defines the path. The lower timeframe defines whether that path is executable now.
The StructFirst Internal–External Structure Checklist
Higher-Timeframe Structure
- What timeframe controls this trade?
- Is the market trending, ranging, or unresolved?
- Where are the external high and external low?
- Which swing is protected?
- What would invalidate the broader structure?
External Liquidity
- Where is major buy-side liquidity?
- Where is major sell-side liquidity?
- Has either external boundary been reached?
- Was the move a sweep or accepted breakout?
Internal Structure
- What is the current lower-timeframe sequence?
- Is it aligned with or counter to the higher timeframe?
- Did CHoCH or BOS break a meaningful swing?
- Is the change local, corrective, or capable of affecting external structure?
Displacement
- Did candle bodies expand?
- Did overlap decrease?
- Did price break protected structure?
- Did the move leave an imbalance?
- Was the displacement immediately reclaimed?
Acceptance
- Did price remain beyond the broken level?
- Did the retest hold?
- Did a protected execution swing form?
- Did follow-through develop?
Execution
- Is internal structure confirming an existing higher-timeframe thesis?
- Is the trade aligned or countertrend?
- Is an efficient entry still available?
- Is invalidation structurally defined?
Risk
- What invalidates the entry?
- What invalidates the broader thesis?
- Are those two levels being confused?
- Does the next target justify the required risk?
Target
- Is the first objective internal liquidity?
- Is the primary objective external liquidity?
- Will partial profit be taken before the external target?
When several answers remain unclear, the setup is not ready.
No-Trade Conditions
No-trade is appropriate when:
- the higher-timeframe structure is unresolved,
- price is in the middle of an external range,
- internal BOS and CHoCH signals repeatedly alternate,
- external liquidity remains unfinished on both sides,
- the protected swing is unclear,
- displacement is absent,
- the breakout lacks acceptance,
- internal structure conflicts with the higher timeframe but offers poor countertrend reward,
- invalidation requires mixing unrelated timeframes,
- the efficient entry has already passed,
- or the analysis depends on forcing a structural or Wyckoff label.
No-trade is not failure to understand the market.
It is recognition that the current structural hierarchy does not provide a clear risk decision.
Frequently Asked Questions
What Is the Difference Between Internal and External Market Structure?
Internal structure consists of smaller swings developing inside a larger trend leg or range. External structure consists of the major highs, lows, protected swings, and boundaries that control the larger auction.
Does an Internal BOS Change the Trend?
Not automatically. It may confirm local continuation, a corrective rally, or an intraday trade without changing the higher-timeframe trend.
Can Internal Structure Be Bullish While External Structure Is Bearish?
Yes. The internal bullish sequence may represent a retracement, short covering, or movement toward higher-timeframe premium.
Which Timeframe Controls the Trend?
The controlling timeframe depends on the trade being planned. The timeframe defining the thesis should control directional bias, while lower timeframes refine execution.
What Is a Protected Swing?
A protected swing is the high or low whose failure would materially weaken or invalidate the active directional sequence.
Is Every External High or Low a Liquidity Target?
Major visible highs and lows often contain liquidity, but price is not required to reach every pool immediately. Active structure and delivery determine which objective is relevant.
Can a Liquidity Sweep Change External Structure?
The sweep alone cannot. A meaningful external shift requires displacement, a relevant swing break, acceptance, and follow-through.
Is CHoCH Internal or External?
CHoCH can occur on either layer. Its significance depends on the timeframe, the swing that broke, the surrounding liquidity, and the price response.
When Does an Internal Shift Become an External Reversal?
It becomes more credible when external liquidity is reached, displacement breaks the protected swing, price accepts beyond external structure, the retest holds, and continuation develops.
Should I Trade Against the Higher-Timeframe Structure?
Countertrend trades can be valid, but targets should remain limited, invalidation should be tight, and the trader must recognize that the higher-timeframe structure may reassert control.
Can My Entry Fail While the Higher-Timeframe Thesis Remains Valid?
Yes. A lower-timeframe execution can fail without invalidating the broader thesis. Entry invalidation and thesis invalidation should be defined separately.
Why Are Trading Ranges Difficult?
Ranges contain frequent internal structural changes while external boundaries remain unresolved. The middle often provides weak asymmetry and unclear control.
Is a Spring an External or Internal Event?
The move beneath range support is an external liquidity event relative to the range. The CHoCH, BOS, FVG, and entry sequence that follow are internal confirmation.
Is BOS More Important Than CHoCH?
Neither is universally more important. The relevant questions are which swing broke, what structural layer it belonged to, and whether the break produced acceptance and follow-through.
Conclusion
The market does not assign equal importance to every swing.
Neither should the trader.
Internal market structure describes how price is moving inside the larger auction.
External market structure defines whether that larger auction remains intact.
Internal BOS and CHoCH signals can provide:
- early warning,
- execution confirmation,
- trade management,
- and short-term opportunity.
They do not automatically change the controlling trend.
External structure changes only when meaningful boundaries and protected swings fail with sufficient evidence:
- liquidity interaction,
- displacement,
- candle-body acceptance,
- retest confirmation,
- and follow-through.
This is why structural trading must remain hierarchical.
A five-minute reversal can be a one-hour pullback.
A fifteen-minute uptrend can be a four-hour retracement.
A bullish BOS can be a range rotation.
A bearish CHoCH can be temporary profit-taking.
A Spring can fail.
A Sign of Weakness can be invalidated.
The label is never the complete decision.
The swing, timeframe, location, liquidity, response, and failure condition determine its meaning.
The complete StructFirst process is:
External Structure
→ External Liquidity
→ Internal Delivery
→ Displacement
→ Confirmation
→ Acceptance
→ Execution
→ Invalidation
→ Target Liquidity
The central lesson is simple:
Not every swing deserves equal weight. Identify which structure controls direction and which structure only refines execution.
Expand Your Structural Edge
Start with Why Market Structure Comes First: The StructFirst Trading Framework to establish the higher-timeframe hierarchy behind every StructFirst decision.
Continue with What Is a Liquidity Sweep? Confirmation, Failure, and Execution to understand why external liquidity creates the event but does not confirm the outcome.
Then read What Is Displacement in Trading? Why Strong Candles Alone Are Not Enough to identify when a structural break represents genuine repricing rather than temporary volatility.
Finally, use BOS vs CHoCH vs Market Structure Shift: What Actually Confirms a Trend Change? to connect protected swings, displacement, acceptance, and external trend confirmation.
Track the live order flow and volume footprint yourself directly on TradingView.
Leave a Reply