Historical Structural Review | BTCUSDT Perpetual | 12H | Bybit | Chart Captured July 15, 2026
The original analysis described the Bitcoin 12-hour range as having a high probability of Wyckoff accumulation.
That conclusion was too certain for the evidence available at the time.
The chart supported an accumulation hypothesis, but it did not confirm that larger participants were building long inventory or that a markup phase was ready to begin.
What the chart visibly showed was a broad trading range after a major decline, repeated interaction with the lower boundary, declining internal volatility, and a recovery toward resistance.
Those observations created a valid research question:
Was the range absorbing supply before a bullish transition, or was price only consolidating before another expansion lower?
The answer depended on liquidity behavior, displacement, acceptance, and failure logic—not on the Wyckoff label alone.
This is a historical structural review, not a current Bitcoin trade signal.
Market Status
| Component | Structural Reading |
|---|---|
| Working Hypothesis | Possible Wyckoff accumulation |
| HTF Structure | Broad 12H range after significant markdown |
| Range Condition | Internally compressed and unresolved |
| Lower Reference | 59,800 and the descending lower boundary |
| Upper Reference | AR region and descending range resistance |
| Liquidity | Sell-side liquidity remained concentrated beneath visible lows |
| Confirmation | Bullish recovery visible; Sign of Strength unconfirmed |
| Invalidation | Sustained 12H acceptance below the lower range structure |
| Trade Status | No trade in the middle of the unresolved range |
1. Key Structural Problem
The central problem was not identifying a possible Selling Climax, Automatic Rally, or Secondary Test.
The problem was determining whether the full range behavior confirmed accumulation.
A range that follows a large decline can represent:
- accumulation;
- redistribution;
- short covering;
- temporary balance;
- or an unresolved transition.
The same visual range can support opposing hypotheses until price reveals which boundary it can accept beyond.
Labeling the range as accumulation before that confirmation creates directional bias. Once the bullish label is accepted, every lower wick can be misread as absorption and every rally can be promoted into a Sign of Strength.
The correct starting point was therefore:
The range may be accumulating, but the market must confirm the hypothesis through its behavior at the boundaries.
For the broader decision process behind this approach, see Why Market Structure Comes First: The StructFirst Trading Framework.
2. HTF Structure
The 12-hour chart developed after a sharp bearish expansion from above the visible range.
Price then established a broad consolidation bounded by a descending upper trend line and a gradually declining lower boundary.
The chart marked three early Wyckoff candidates:
- SC: a possible Selling Climax near the initial lower boundary;
- AR: an Automatic Rally candidate near the upper portion of the range;
- ST: a Secondary Test candidate formed after the AR.
These labels were structurally reasonable as working references, but they did not independently confirm accumulation.
The range remained below the earlier high, while the upper boundary continued to act as resistance. The July recovery improved internal structure but had not yet demonstrated sustained acceptance above the AR region.
This distinction between local improvement and external trend change is explained in Internal vs External Market Structure: Which Swing Actually Controls the Trend?.
Confirmed Observation:
Price recovered from the lower portion of the range and formed a sequence of higher internal lows.
Structural Inference:
Immediate bearish pressure had weakened.
Unconfirmed Possibility:
The recovery could develop into a bullish structural transition.
The external range remained unresolved until one boundary produced acceptance.
3. Liquidity Positioning
The 59,800 level acted as a visible lower reference inside the range.
Sell-side liquidity was likely concentrated beneath:
- the initial SC region;
- repeated lows around 59,800;
- the later June low;
- and the descending lower range boundary.
Price traded below 59,800 during the later part of the range and then recovered.
That event was important, but it did not automatically confirm a Wyckoff Spring.
A liquidity event can lead to three broad outcomes:
- rejection and reversal;
- continuation after temporary liquidity access;
- breakout and acceptance beyond the boundary.
The distinction depends on what happens after the liquidity is accessed. This framework is developed in What Is a Liquidity Sweep? Confirmation, Failure, and Execution.
For the bullish hypothesis, the market needed to reject the lower area, reclaim the range, produce meaningful displacement, and preserve the reclaimed structure.
For the bearish hypothesis, sustained acceptance below the late-June low and lower boundary would indicate that the range had failed to absorb supply.
4. Wyckoff / ICT Context
From a Wyckoff perspective, the chart supported a possible accumulation range but did not complete the full progression required for confirmation.
The early structure could be interpreted as:
Possible SC
→ AR
→ ST
→ Extended Phase B Range Development
The later move beneath 59,800 could be treated as a Spring candidate because price recovered back into the range.
However, a Spring is not confirmed by the sweep alone.
The market still needed to demonstrate:
- failed acceptance below support;
- a decisive return into the range;
- reduced supply on a test;
- bullish displacement;
- a relevant structural break;
- and a Sign of Strength toward or through the upper boundary.
From an ICT perspective, the lower move accessed sell-side liquidity. The subsequent rally became structurally relevant only if it repriced through meaningful internal resistance and held the resulting bullish structure.
Neither framework justified entering simply because price moved beneath a prior low.
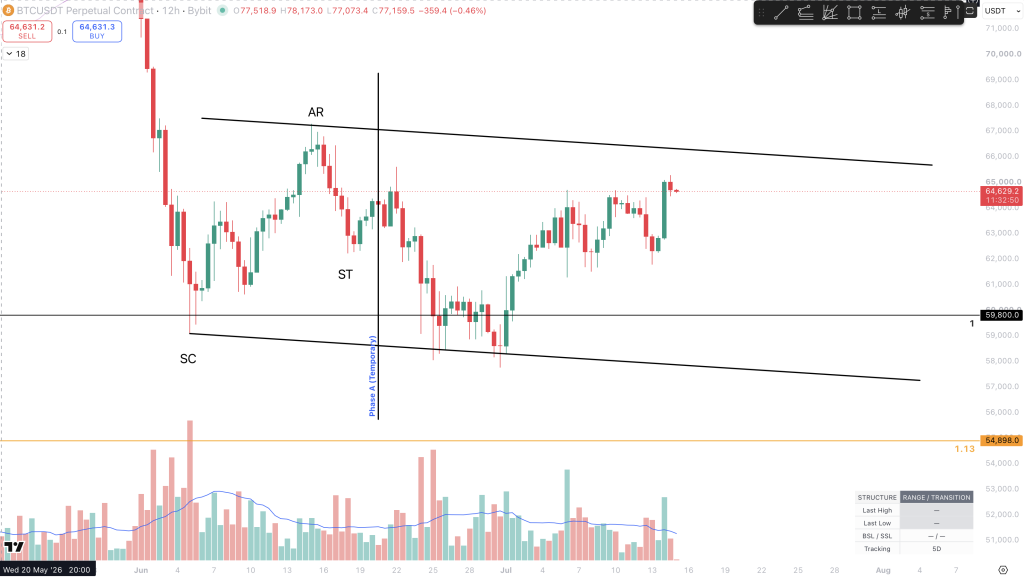
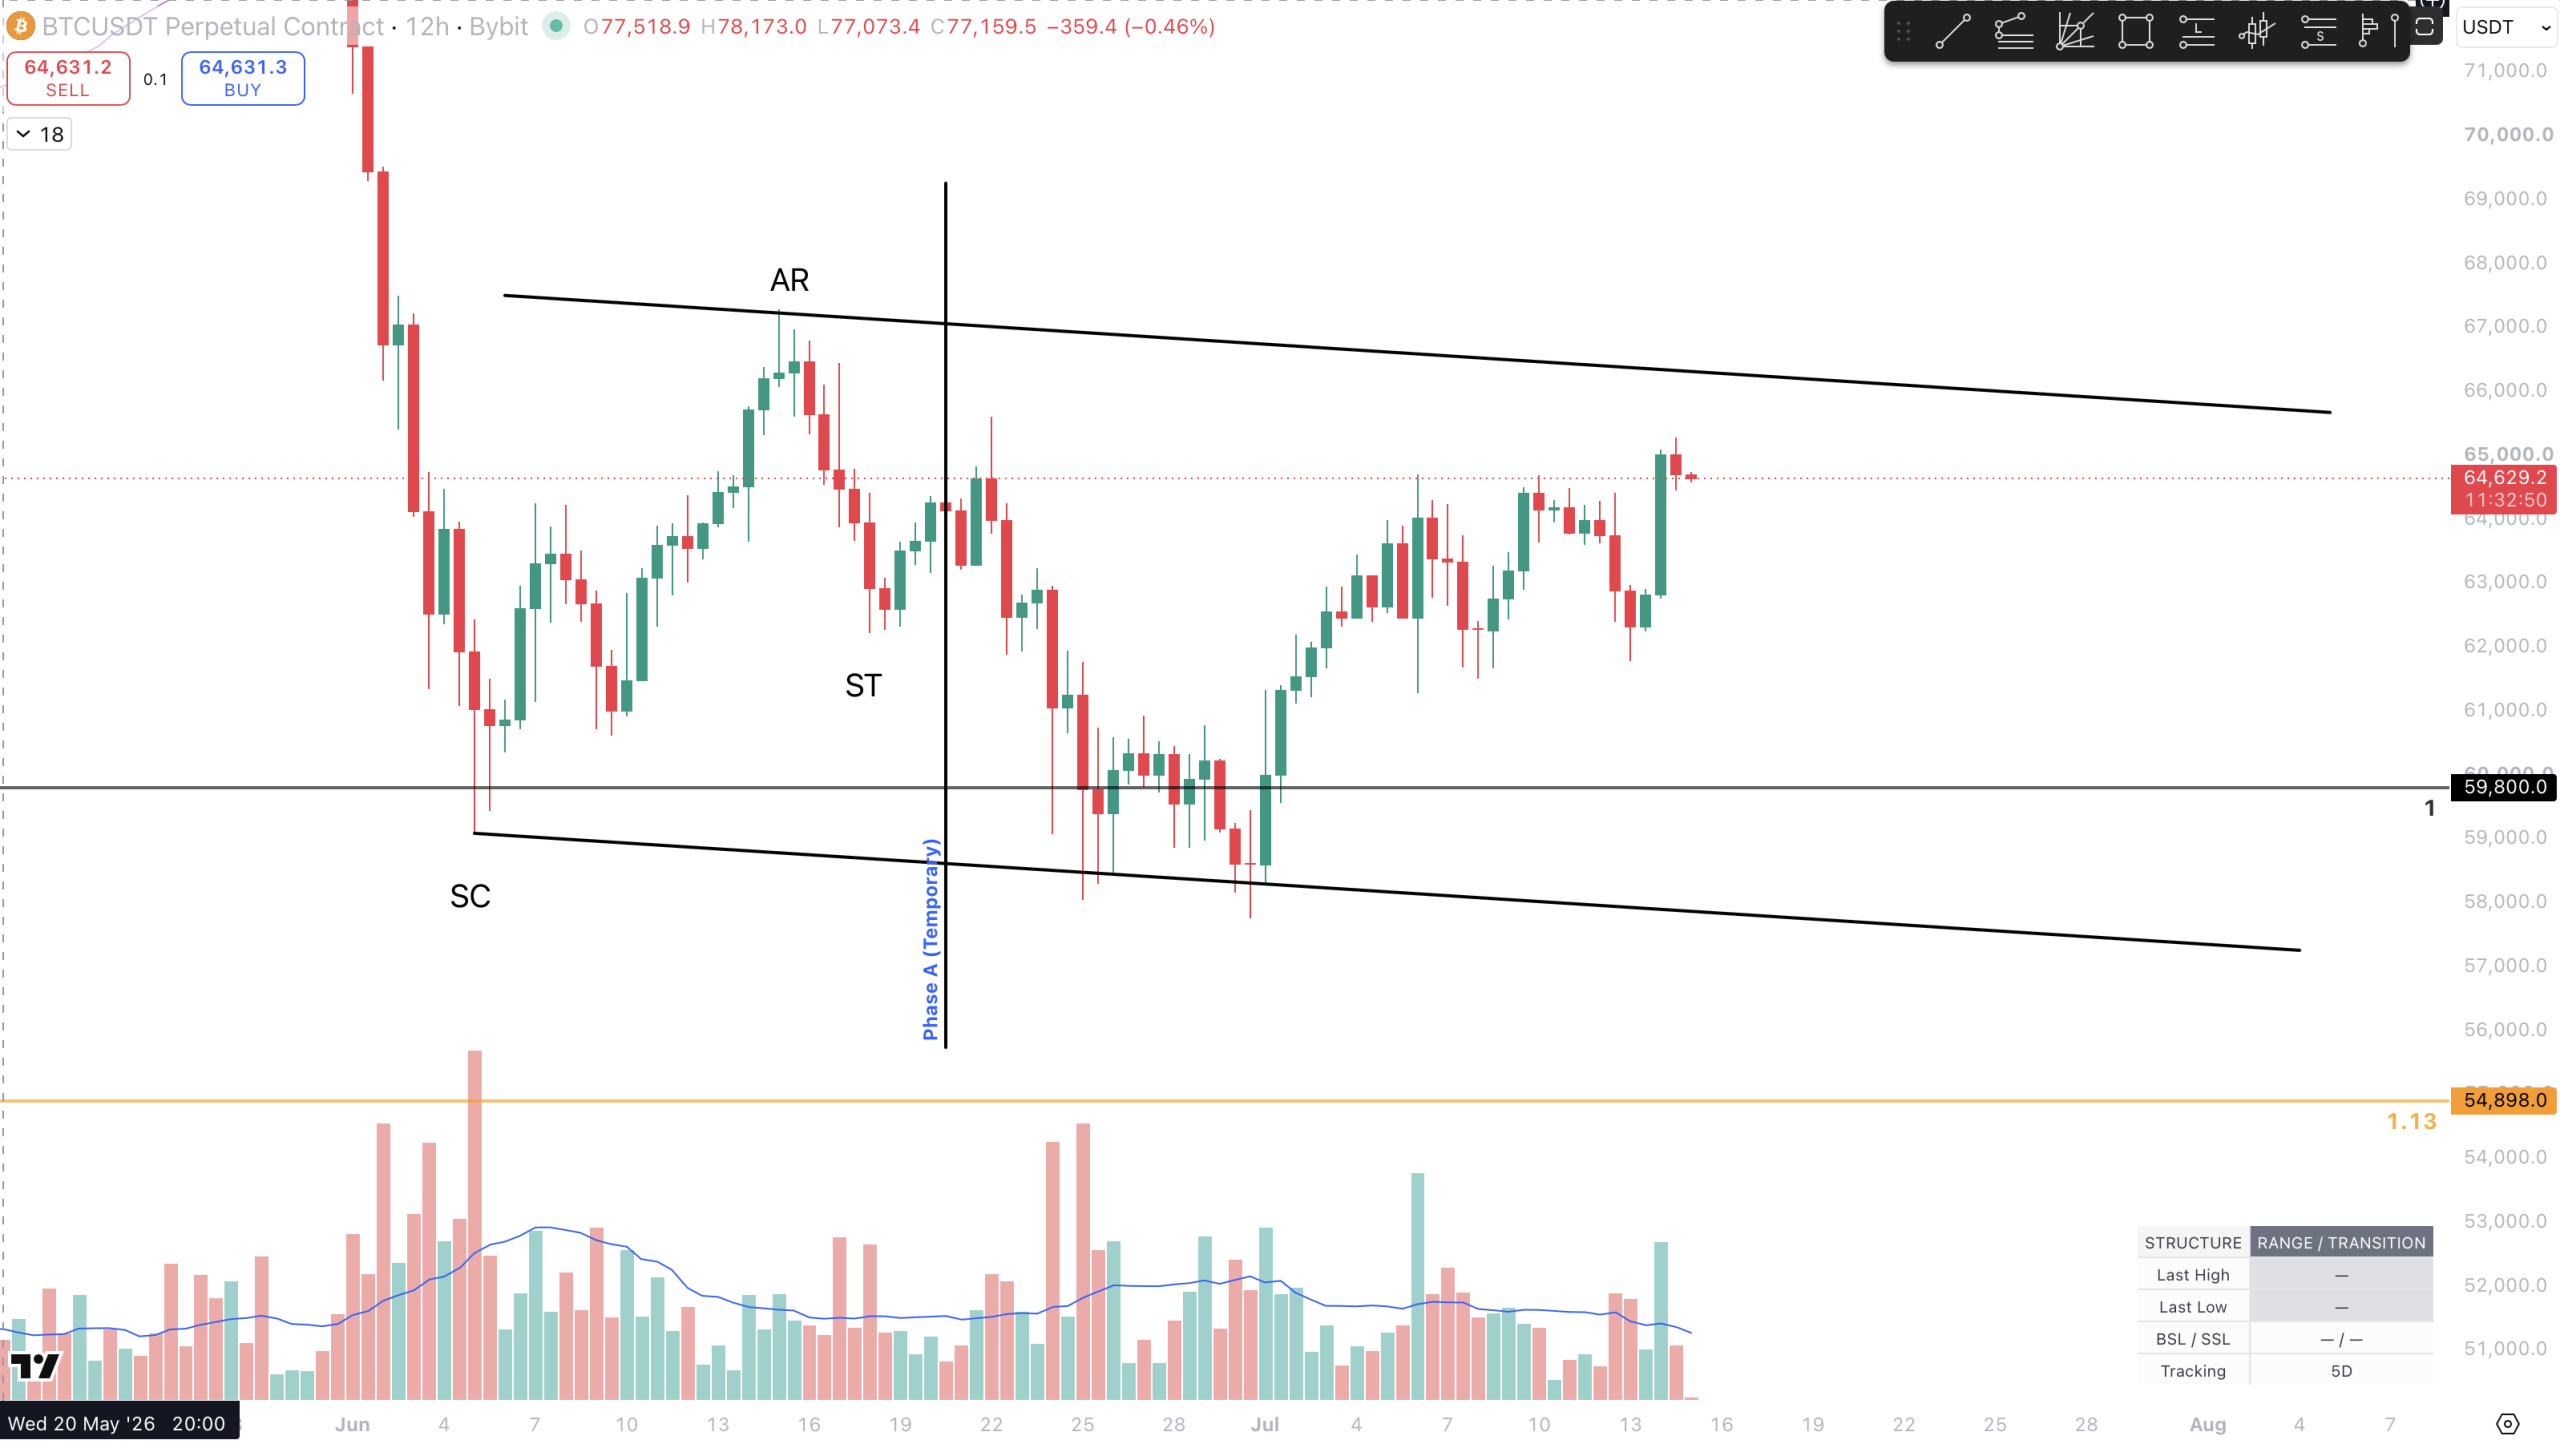
The BTCUSDT Perpetual 12-hour chart shows the market balancing after a sharp markdown. The initial decline produced increased volume near the possible SC, followed by an AR and ST candidate.
Later in the range, price traded beneath the 59,800 reference and tested the descending lower boundary before recovering. The rebound improved internal structure, but price remained beneath the upper range boundary and AR region.
The chart therefore supported an accumulation hypothesis while preserving a valid bearish continuation scenario. Confirmation required bullish displacement and sustained acceptance above resistance.
The recovery became structurally meaningful only after price produced confirmed displacement through relevant resistance. For a deeper explanation, see What Is Displacement in Trading? Why Strong Candles Alone Are Not Enough.
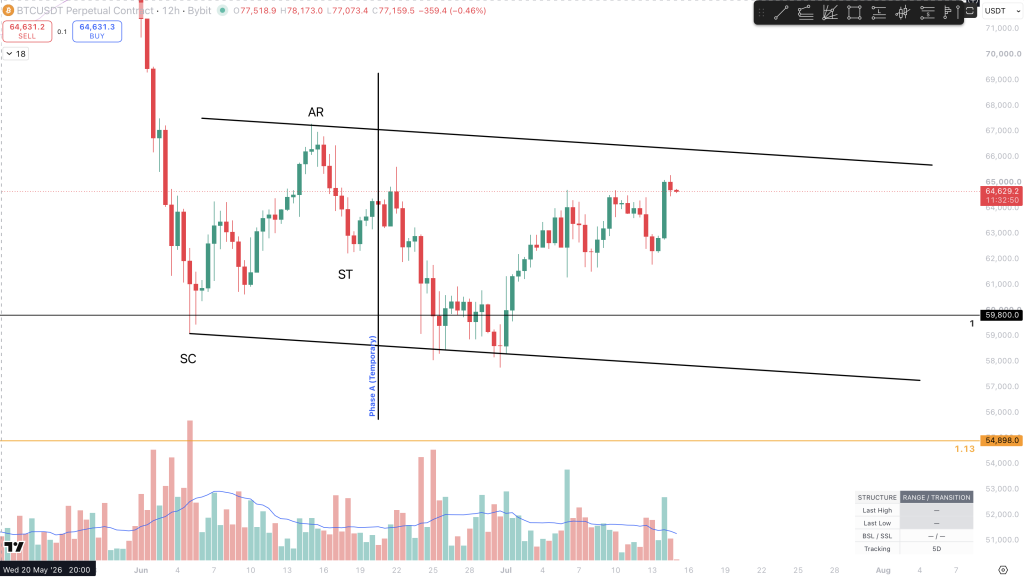
The BTCUSDT Perpetual 12-hour chart shows the market balancing after a sharp markdown. The initial decline produced increased volume near the possible SC, followed by an AR and a subsequent ST candidate.
Later in the range, price moved beneath the 59,800 reference and tested the descending lower boundary. The market recovered from that area and developed a series of higher internal lows into July.
This recovery was bullish evidence, but it was not yet a confirmed Sign of Strength. Price remained beneath the descending upper boundary and the AR region, where unresolved supply could still interrupt the advance.
The chart therefore supported an accumulation hypothesis while preserving a valid bearish alternative.
5. Intent
The chart could not directly confirm that institutions were accumulating Bitcoin.
Participant identity and inventory cannot be proven from candles and volume alone.
What could be evaluated was the market’s observable response.
Bullish intent was suggested by:
- failure to sustain lower prices after the late-June decline;
- recovery above the 59,800 reference;
- improving internal lows;
- repeated movement back toward the upper half of the range;
- and reduced immediate downside continuation.
However, the recovery did not yet demonstrate the type of decisive expansion required to confirm control.
Intent would become more credible if price produced:
Lower-Boundary Reclaim
→ Bullish Displacement
→ Relevant Resistance Break
→ Retest Hold
→ Acceptance Above the Range
The difference between ordinary candle expansion and structurally meaningful movement is explained in What Is Displacement in Trading? Why Strong Candles Alone Are Not Enough.
6. Confirmation
Accumulation required confirmation through both price structure and volume behavior.
Bullish confirmation
The bullish hypothesis strengthened if price:
- preserved the late-June low;
- held above the reclaimed 59,800 area;
- displaced through the July internal highs;
- broke the descending upper boundary;
- recovered the AR region;
- and established 12-hour acceptance above resistance.
A temporary wick above the upper boundary would not be sufficient.
The breakout needed continued trading above the range, followed by either value formation or a successful retest.
Volume confirmation
Volume had to be interpreted through effort versus result.
Large volume near the lower boundary could indicate absorption, liquidation, or continued aggressive selling. The interpretation depended on the subsequent price result.
Stronger bullish evidence would include:
- reduced volume on a lower-boundary test;
- expanding price progress on the rally;
- decisive closes near candle highs;
- and continued acceptance after resistance was broken.
Structural confirmation
An internal CHoCH could indicate that the immediate bearish sequence had weakened.
It would not automatically confirm that the entire 12-hour structure had reversed.
A stronger Market Structure Shift required displacement through a meaningful controlling swing and acceptance beyond it. See BOS vs CHoCH vs Market Structure Shift: What Actually Confirms a Trend Change?.
7. Invalidation
The accumulation hypothesis should not be invalidated by every wick beneath 59,800.
The chart had already shown that price could trade below that reference and recover.
More meaningful invalidation required:
- sustained 12-hour acceptance beneath the late-June low;
- failure to reclaim the lower range boundary;
- continued lower highs after the breakdown;
- expanding bearish displacement;
- and unsuccessful retests of the former support.
The hypothesis also weakened before full invalidation if:
- the July recovery repeatedly failed beneath the AR region;
- bullish displacement was immediately erased;
- price returned to the lower boundary without creating higher structural progress;
- or volume expanded while price achieved little upward result.
Invalidation was therefore a structural process, not a single arbitrary stop level.
8. Execution Condition
The middle of the range did not provide an efficient execution location.
Price in equilibrium offered:
- unclear directional control;
- nearby liquidity on both sides;
- wide structural invalidation;
- and poor reward relative to either boundary.
A conditional bullish execution required one of two models.
Lower-boundary confirmation model
- Price accesses sell-side liquidity near the lower boundary.
- Price fails to accept below the range.
- Bullish displacement breaks a relevant lower high.
- A retracement preserves the displacement origin.
- Target liquidity remains available near the upper range.
Breakout-and-retest model
- Price displaces through the descending upper boundary and AR region.
- Twelve-hour candles establish acceptance above resistance.
- The former boundary holds during a retest.
- Lower-timeframe structure confirms continuation.
- Buy-side liquidity remains available above the range.
A Fair Value Gap created during confirmed displacement could refine entry, but it could not create the trade thesis by itself. See How to Read a Fair Value Gap in Market Structure.
9. Harmonic / PRZ Check
The supplied chart did not present a clearly defined harmonic structure or confirmed Potential Reversal Zone.
No harmonic label should be added merely to create additional confluence.
The relevant analytical tools were:
- range structure;
- Wyckoff progression;
- liquidity;
- volume;
- displacement;
- and acceptance.
Harmonic Status: Not required and not confirmed.
This is a valid professional conclusion. Every framework does not need to appear in every analysis.
10. MDA D1–D10 Verification
| Verification Layer | Evidence Status |
|---|---|
| D1 | Major bearish expansion preceded the range |
| D2 | The 12H market remained range-bound and externally unresolved |
| D3 | Sell-side liquidity was visible beneath repeated lower references |
| D4 | Volume expanded around major lower-range events |
| D5 | Bullish intent remained a structural inference |
| D6 | Internal bullish recovery developed from the late-June low |
| D7 | External resistance and the AR region remained unrecovered |
| D8 | No efficient middle-range execution was available |
| D9 | Acceptance beneath the lower range would invalidate accumulation |
| D10 | No trade remained valid until boundary confirmation developed |
The MDA result was mixed rather than uniformly bullish.
Lower-range behavior supported the accumulation hypothesis, while the absence of external acceptance prevented confirmation.
11. Primary Scenario
The primary scenario was a conditional bullish range resolution.
For this scenario to develop, price needed to:
- preserve the late-June low;
- maintain acceptance above the reclaimed lower structure;
- produce bullish displacement through the internal July highs;
- break the descending upper boundary;
- recover the AR region;
- and hold above the range during a retest.
That sequence would strengthen the interpretation that supply had been absorbed and that the range was transitioning toward markup.
A Spring label would become more credible only after the market delivered the expected structural result.
12. Secondary Scenario
The secondary scenario was failure beneath the upper boundary followed by rotation back toward sell-side liquidity.
Under this scenario:
- the July rally would remain an internal range movement;
- price would fail to establish acceptance above the AR region;
- the upper boundary would continue to attract supply;
- and the market would revisit 59,800 or the lower range boundary.
If the lower boundary then failed with bearish displacement and sustained acceptance, the accumulation hypothesis would be invalidated.
The range could instead represent redistribution or bearish continuation.
A confirmed historical redistribution sequence is examined in Bitcoin Wyckoff Redistribution: How the 6H Structure Confirmed Markdown.
13. Target Liquidity
Targets depended on which boundary confirmed.
Bullish target sequence
The first bullish objective was the internal buy-side liquidity above the July highs.
The next objective was the AR region and descending upper boundary.
Only sustained acceptance above the range would expose larger external buy-side liquidity.
Bearish target sequence
If the upper recovery failed, the first bearish objective was the 59,800 reference.
The next objective was the late-June low and lower range boundary.
Acceptance beneath that structure would expose lower external liquidity.
Targets had to follow confirmed range resolution. They should not be projected before invalidation and acceptance were defined.
14. Risk Assessment
The main risk was not missing the eventual breakout.
It was trading the middle of an unresolved range while assuming the Wyckoff label had already determined direction.
Specific risks included:
- treating SC, AR, and ST labels as proof of accumulation;
- assuming the move below 59,800 was automatically a Spring;
- interpreting every high-volume decline as bullish absorption;
- confusing internal higher lows with external trend reversal;
- entering before displacement;
- placing a stop directly beneath a visible liquidity level;
- and targeting markup before the AR region was reclaimed.
The range could produce sharp movement in both directions before resolution.
Risk had to remain subordinate to confirmation.
15. No-Trade Conditions
No trade was justified when:
- price remained near the center of the range;
- the upper and lower boundaries were both intact;
- a sweep occurred without displacement;
- bullish displacement failed to break meaningful resistance;
- a breakout lacked sustained acceptance;
- volume and price result remained contradictory;
- invalidation required an excessively wide stop;
- opposing liquidity was too close;
- or the setup depended primarily on calling the range accumulation.
No-trade was not indecision.
It was the correct response to unresolved structure.
Lessons From the Range
The Bitcoin 12-hour chart demonstrated why Wyckoff labels must remain conditional until the sequence is complete.
The possible SC, AR, ST, Spring candidate, and internal compression created a coherent accumulation hypothesis.
They did not prove that accumulation had occurred.
The range still needed to answer three questions:
- Could price establish acceptance above the upper boundary?
- Could bullish displacement survive a retest?
- Would the lower boundary remain protected if the rally failed?
Until those questions were resolved, the market remained a range with competing scenarios.
Expand Your Structural Edge
Accumulation is not confirmed because a range forms after a decline.
A Spring is not confirmed because price trades beneath support.
Absorption is not confirmed because volume expands near a low.
Each interpretation must produce the structural result expected from it.
For the bullish hypothesis, that result required displacement, acceptance above resistance, and preservation of the reclaimed structure.
For the bearish alternative, failure at the upper boundary followed by acceptance below the lower range would invalidate accumulation.
The professional process was therefore:
HTF Structure
→ Range Boundaries
→ Liquidity
→ Volume and Intent
→ Confirmation
→ Invalidation
→ Execution
→ Target Liquidity
Track the live order flow and volume footprint yourself directly on TradingView.
Leave a Reply