Tag: Institutional Trading

  • Live Briefing #001-BTC 4H Structure: The Heavy Resistance Block

    In structural trading, identifying where the institutional supply rests is just as important as finding the setup itself. Currently, the Bitcoin 4-Hour (4H) chart presents a clear structural problem for buyers.

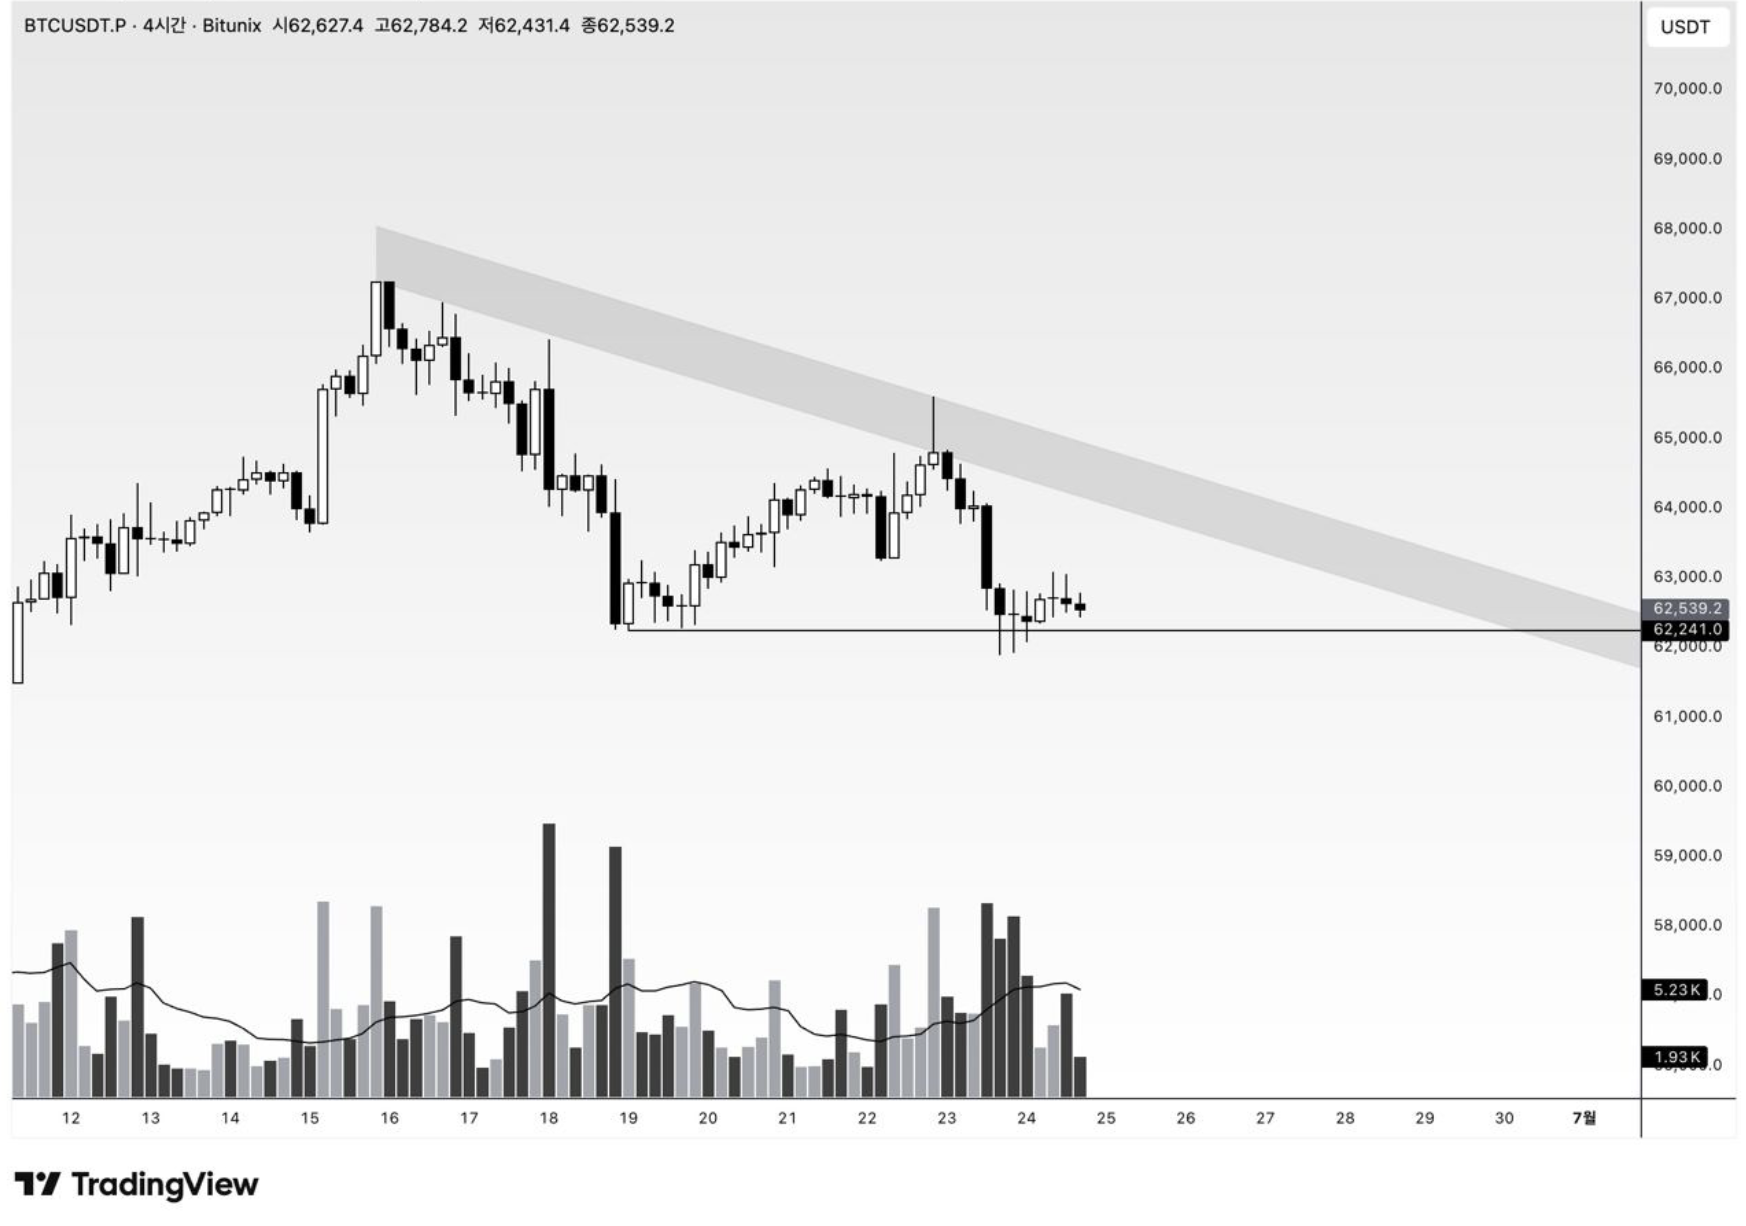
    BTC 4H Structure: Heavy Supply Zone capping the upside movement.


    Looking at the current price action, we can clearly define the upper and lower boundaries. However, the most critical element here is the sheer thickness of the upper resistance line (Supply Block).

    • The Structural Problem: The market is compressing against a massive, heavy supply zone. Breaking through this level requires significant institutional intent (Displacement) and aggressive market buying, which is currently absent.
    • Current State: It is highly improbable for retail volume alone to slice through this thick resistance. We are seeing rejection wicks confirming the strong presence of sellers actively defending this zone.

    HTF Context: Why is this Resistance so Heavy?


    Top-Down View: The 4H resistance aligns with critical HTF supply.

    We do not look at the 4H timeframe in isolation. If we zoom out to the Daily (D1) structure, this 4H resistance block perfectly aligns with a Higher Timeframe (HTF) distribution zone. There are trapped long positions from previous weeks actively looking to break even, creating a massive wall of sell limit orders. This is why the overhead supply is dynamically thick.

    Liquidity Positioning & Target Map

    Markets move from one liquidity pool to another. If the Smart Money intent is not to break this upper resistance, they will distribute current holdings and target the liquidity resting below.

    • Buy-Side Liquidity (BSL): Resting above the thick gray box. Untapped, but highly protected by sellers.
    • Sell-Side Liquidity (SSL): Look at the recent swing lows formed during this consolidation. Retail traders are placing their stop-losses just below these obvious support lines. If the upper resistance holds, this SSL is the primary magnetic target for the algorithmic delivery.

    Execution Plan & Scenarios

    We do not predict the direction; we react to the structure. Here is the operational plan for the session:

    • Primary Scenario (Rejection): Price sweeps the local highs into the supply box but closes back inside the range (Failure to displace). Execution: Look for short setups targeting the SSL resting at the local lows.
    • Secondary Scenario / Invalidation: A full-bodied 4H candle close above the thick resistance block, completely clearing the supply. This invalidates the bearish bias. We then wait for a structural retest to flip resistance into support before looking for longs.
    • No-Trade Condition: Trading the middle of this chop is a gamble. If the price remains compressed between the supply box and the immediate local support without sweeping either side, we sit on our hands. Capital preservation is the priority.

    Conclusion: Do not anticipate the breakout. Wait for the confirmation. Until this resistance is structurally broken and retested as support, the path of least resistance remains sideways or downward.

  • [Wyckoff Redistribution] BTC 6 H Smart Money Trap

    Understanding the mechanics of a Wyckoff Redistribution is essential if you have ever experienced the pain of buying a “perfect breakout” only to watch it instantly reverse, or shorting a “confirmed breakdown” right at the exact bottom. You might blame the news, faulty lagging indicators, or simply bad luck.

    But the reality is much colder: You were trapped by the structure. Institutional capital (Smart Money) designs these liquidity traps to fill their massive orders. To avoid becoming their liquidity, you must understand the Wyckoff Logic.

    The Anatomy of a Trap: Wyckoff Redistribution

    Before we dive into a live chart application, we must first decode the institutional blueprint. Below is the textbook schematic of a Wyckoff Redistribution.

    Unlike a sudden market crash, a redistribution phase is a carefully orchestrated campaign. When Smart Money decides to halt a temporary markup to unload their remaining long positions—or to build a massive short inventory—they cannot simply hit the market “sell” button. Doing so would collapse the price prematurely, resulting in severe price slippage and ruining their average execution price.

    Instead, they construct a horizontal trading range. This consolidation creates an illusion of support, tricking retail breakout traders into believing a bullish continuation is imminent. Within this range, the algorithm deliberately engineers fakeouts at the boundaries, systematically sweeping both the Buy-Side Liquidity (BSL) at the highs and the Sell-Side Liquidity (SSL) at the lows.

    The ultimate goal of this schematic is the transfer of risk. It is a highly efficient mechanism designed to transfer holdings from the informed institutional operator to the uninformed retail public. By understanding the specific phases of this Wyckoff schematic, you can identify exactly when the trap is fully set and ready to spring.

    Read our previous analysis: The StructFirst Manifesto

    Wyckoff Redistribution Schematic: The institutional blueprint for trapping retail liquidity.


    Redistribution is a phase where Smart Money halts a temporary rally to unload their remaining positions before driving the price lower. It consists of specific phases:

    • Phase A (Stopping the Trend): The initial buying climax and automatic reaction establish the trading range.
    • Phase B (Building the Cause): The market chops sideways. This is where retail traders are chopped up, and Smart Money secretly builds their short positions.
    • Phase C (The Trap): The Upthrust (UT). Price breaks above the resistance, triggering retail breakout buyers and hunting stop-losses. This is the ultimate trap.
    • Phase D & E (The Markdown): Price breaks back into the range, shows Signs of Weakness (SOW), and prints Last Points of Supply (LPSY) before the structural breakdown.

    Structure in Action: BTC 6H Chart Analysis

    Theory is useless without practical application. Let’s look at how this exact schematic played out on the recent Bitcoin 6-Hour chart.

    Wyckoff Redistribution Schematic
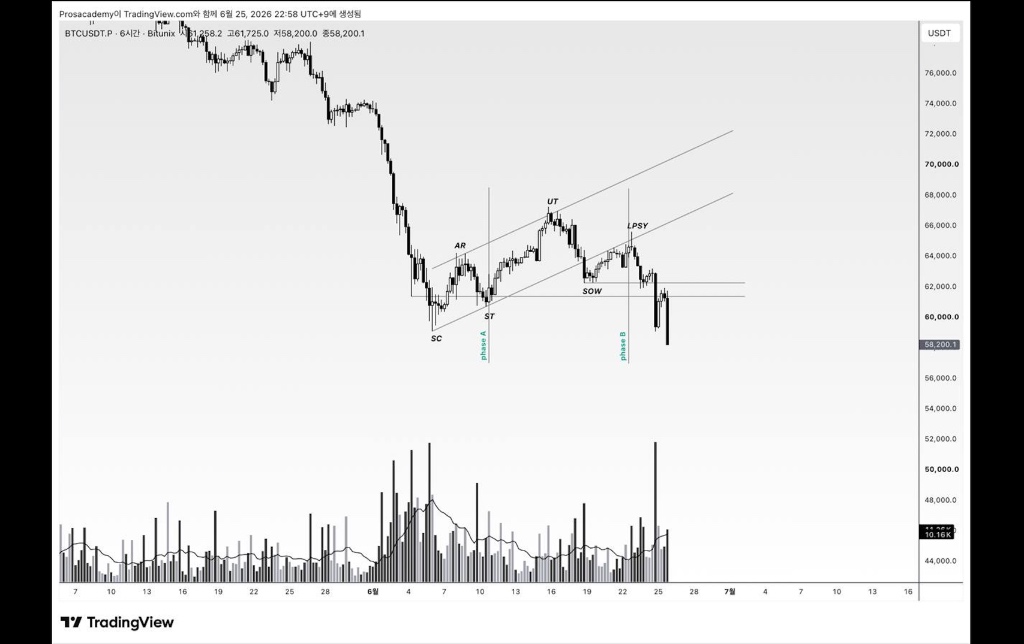
    Structure in Action: BTC 6H Redistribution trapping retail breakouts

    .

    Notice how the live chart perfectly mirrors the textbook schematic:

    1. Phase A: The Selling Climax (SC) and Automatic Rally (AR) defined our initial structural range. The Secondary Test (ST) confirmed the boundaries.
    2. The Upthrust (UT): Look at the UT at the top of the channel. To a retail trader using moving averages, this looked like a confirmed bullish breakout. But structurally, it was an Upthrust—a liquidity sweep designed to trap late buyers.
    3. Sign of Weakness (SOW) & LPSY: After the trap, the price slammed back into the range, breaking local support (SOW). The subsequent bounce to the LPSY (Last Point of Supply) was the high-probability structural entry for a short position, offering an excellent Risk-to-Reward ratio.

    Look at the volume profile at the bottom. As the price pushed higher toward the UT, the buying volume was visibly drying up (divergence). The effort to push the price up yielded no genuine result.

    Conclusion: Confirmation Over Assumption

    A sweep is not automatically a reversal, and a breakout is not automatically a trend continuation. Do not force Wyckoff labels, but use them to understand who is in control.

    Stop trading the breakout. Start trading the structure.