Research Note #001
A trading range that develops after a sharp decline is not automatically accumulation.
It can represent absorption before recovery, temporary balance after forced selling, or redistribution before another markdown. The shape of the range alone cannot determine which interpretation is correct.
That distinction was central to the Bitcoin 6-hour structure examined in this Research Note.
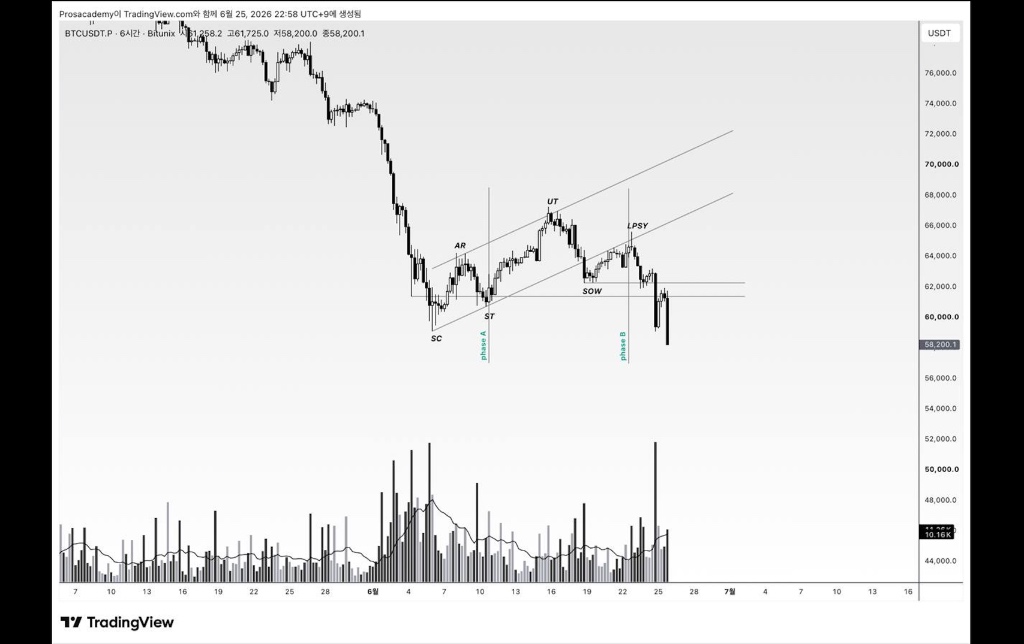
Bitcoin had already experienced a substantial decline before forming a broad recovery range. The initial stabilization, Automatic Rally, and repeated defense of the lower boundary created a plausible accumulation argument. At the same time, price struggled to establish sustained acceptance above the range, buying effort weakened near the upper boundary, and the later recovery attempts failed to restore bullish control.
The range only became structurally consistent with Wyckoff redistribution after a sequence of evidence appeared:
- An Upthrust failed to establish acceptance above the range
- Price returned beneath the upper boundary
- A meaningful Sign of Weakness broke internal support
- The subsequent rally formed a lower Last Point of Supply
- Selling volume expanded as price accepted beneath the range
This distinction matters because a Wyckoff label should describe confirmed price behavior. It should not be used to predict the outcome before the structure develops.
The analysis follows the StructFirst operating sequence:
HTF Structure → Liquidity → Intent → Confirmation → Failure Logic → Execution → Risk Management
For the broader framework behind this process, read Why Market Structure Comes First: The StructFirst Trading Framework.
Key Structural Problem
The central problem was not identifying a trading range.
The difficult question was determining whether the range represented:
- Accumulation after a major decline
- Neutral balance before a larger decision
- Redistribution within the existing bearish structure
At the beginning of the range, all three remained possible.
The prior decline created an important contextual bias, but it did not guarantee continuation. A Selling Climax can mark temporary exhaustion and the beginning of accumulation. It can also create only enough demand to pause the decline before supply regains control.
The trader therefore needed to avoid two premature assumptions.
The first was that the range had to be accumulation because it formed after heavy selling.
The second was that every rally into resistance had to be distribution because the higher-timeframe trend remained bearish.
Neither conclusion was executable without confirmation.
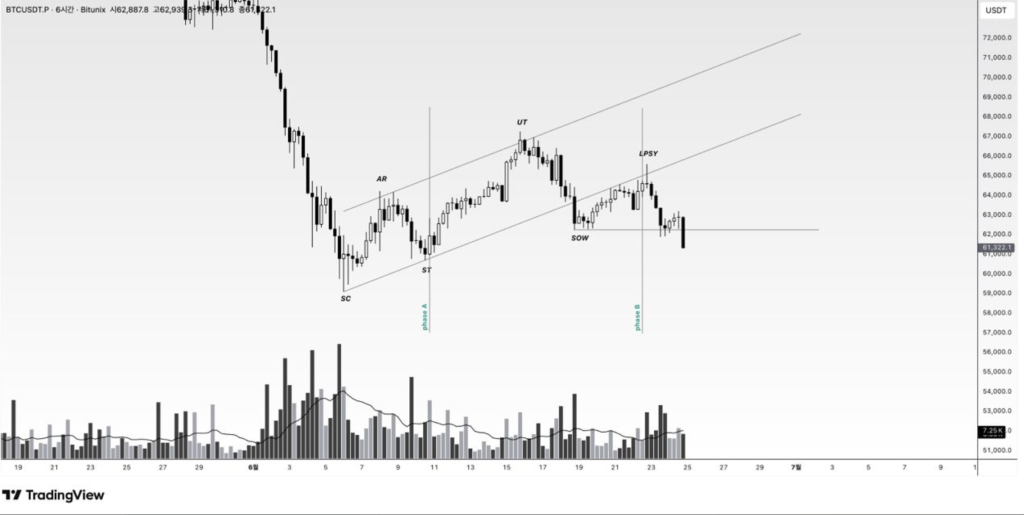
The actual 6H chart showed several developments:
- A steep markdown entered a high-volume reaction area
- A Selling Climax and Automatic Rally defined the initial range
- A Secondary Test revisited the lower portion of the structure
- Price later pushed above internal resistance into an Upthrust candidate
- The breakout failed to establish lasting acceptance
- A Sign of Weakness broke meaningful support
- The rebound that followed created a lower Last Point of Supply
- Price subsequently expanded beneath the range with increasing volume
The important evidence was not any single label. It was the progression from failed recovery to confirmed weakness.
Confirmed Observation
The chart visibly showed:
- A major decline preceding the range
- An initial high-volume response near the low
- Repeated failure to sustain prices above the upper structure
- A later support break
- A weak recovery below the former high
- Bearish expansion beneath the range
Structural Inference
The sequence suggested that available demand was insufficient to reverse the controlling bearish structure and that supply remained active during the recovery.
Unconfirmed Possibility
Before the SOW and LPSY developed, the range could still have evolved into accumulation. Redistribution was a hypothesis—not a confirmed structure.
Separating these categories prevents the analyst from forcing later labels onto information that was not available in real time.
HTF Structure
The 6H range developed inside a larger bearish environment.
Price had already moved through a substantial markdown before the Selling Climax appeared. This meant any bullish interpretation had to overcome more than local range resistance. It had to demonstrate that the higher-timeframe bearish sequence was losing control.
The recovery range did produce several constructive elements:
- The initial sell-off generated significant volume
- Price stopped declining temporarily
- The Automatic Rally demonstrated responsive demand
- The Secondary Test did not immediately create another major low
- The lower portion of the range attracted repeated buying responses
These conditions justified monitoring an accumulation hypothesis.
They did not confirm it.
For accumulation to become the controlling interpretation, price needed to show evidence such as:
- Reduced supply on tests of the lower range
- A successful Spring or terminal shakeout
- Strong bullish displacement
- A Sign of Strength through the upper structure
- Acceptance above resistance
- A higher Last Point of Support
Instead, the later structure produced the opposite sequence.
The Upthrust failed, support weakened, and the recovery after the SOW could not reclaim the prior range high. The larger bearish environment therefore regained control.
Higher-timeframe context did not predict the outcome by itself. It increased the confirmation burden for the bullish thesis.
Liquidity Positioning
Liquidity was concentrated on both sides of the range.
Buy-Side Liquidity
Buy-side liquidity rested above:
- The Automatic Rally high
- Internal swing highs
- The upper channel boundary
- The later Upthrust area
- Visible resistance used by short sellers for stop placement
When price pushed into the Upthrust, it accessed this liquidity.
That event could have produced either continuation or failure.
A breakout followed by sustained acceptance would have strengthened the accumulation or bullish continuation thesis. A breakout followed by rejection, bearish displacement, and structural weakness would support redistribution.
The sweep itself did not decide between those outcomes.
For a complete explanation of this principle, read What Is a Liquidity Sweep? Confirmation, Failure, and Execution.
Sell-Side Liquidity
Sell-side liquidity rested beneath:
- The Secondary Test
- Internal pullback lows
- The lower recovery-channel boundary
- The Sign of Weakness level
- The broader range support
Once price failed at the upper boundary and broke meaningful internal support, these lower pools became increasingly relevant.
However, they should not have been treated as automatic targets before weakness was confirmed.
Liquidity Transfer Inside the Range
The range repeatedly transferred liquidity between its boundaries.
Buyers entered near support. Breakout buyers entered above local highs. Short sellers placed protection above resistance. Range longs placed stops beneath support.
This internal activity created enough opposing flow for larger positions to be exchanged without immediate directional expansion.
The existence of a range did not reveal which participant controlled it. The response at the boundaries did.
Wyckoff / ICT Context
Wyckoff provides a useful framework for evaluating how supply and demand progress through a trading range.
It should not be used as a rigid template.
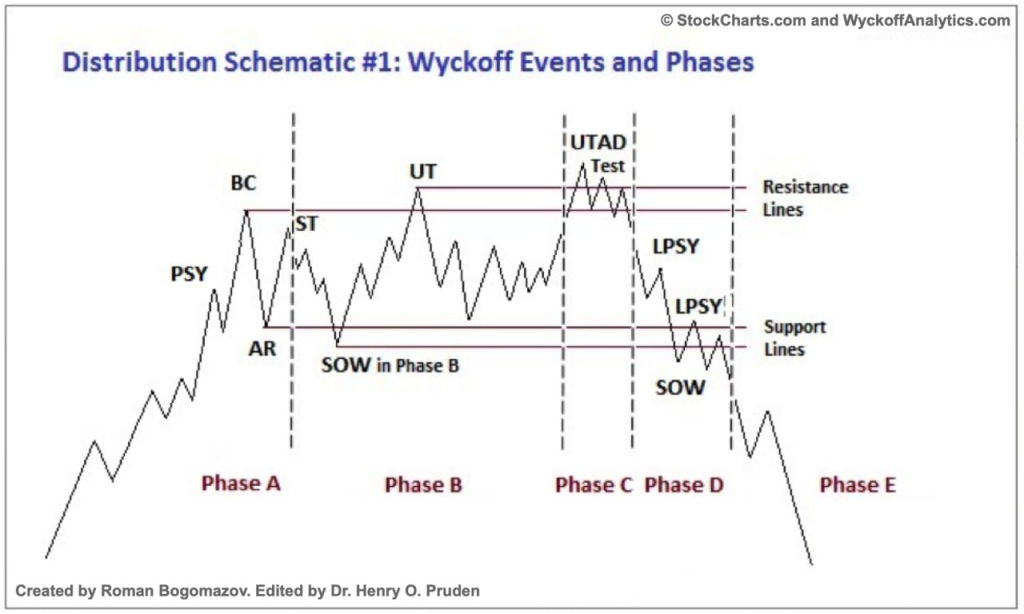
The textbook distribution schematic shows a developed range moving through identifiable phases. The Bitcoin chart did not reproduce every label perfectly, nor was it required to.
The useful structural elements were:
Selling Climax and Automatic Rally
The Selling Climax represented a major increase in selling activity and a temporary halt to the decline.
The Automatic Rally established the initial upper boundary by showing how far responsive demand could move price after the selling pressure eased.
These events defined the range. They did not reveal whether it would become accumulation or redistribution.
Secondary Test
The Secondary Test revisited the lower portion of the structure.
The test helped measure whether supply had diminished. A lower-volume test with limited downward progress can support an accumulation interpretation, but the later behavior still needs to confirm that demand is taking control.
Upthrust
Price later pushed above an important upper boundary.
The Upthrust became relevant because the move failed to establish lasting acceptance and was followed by weakness. Without the failure sequence, it would have remained only a breakout attempt.
Sign of Weakness
The SOW was more important than the initial Upthrust label.
It demonstrated that sellers could move price through a meaningful internal support level. The bearish expansion showed that demand inside the range was no longer maintaining the prior structure.
Last Point of Supply
The rebound after the SOW failed below the previous high and created a lower supply reference.
This LPSY offered evidence that the market was no longer simply rotating inside a neutral range. Buyers could not reclaim the broken structure, and sellers remained active at a lower level.
Within ICT terminology, the Upthrust can also be viewed as a buy-side liquidity event. The SOW and LPSY then provide the structural failure and retracement conditions required before bearish execution.
The frameworks describe the same behavior from different angles. Neither should override the chart.
Intent
Institutional intent cannot be observed directly.
It must be inferred from effort, result, acceptance, displacement, and failure.
During the early range, the evidence was mixed.
The Selling Climax and responsive rally suggested that meaningful buying interest existed. The repeated lower-range defense also showed that sellers were not moving price lower without resistance.
However, the behavior near the top of the range raised a different possibility.
Buying effort produced progressively weaker results. Price pushed toward and beyond resistance but failed to maintain value there. The later support break produced stronger downward progress than the preceding bullish attempts had achieved.
This difference between effort and result was important.
Evidence Supporting a Redistribution Inference
- The upper breakout failed to create acceptance
- Price returned quickly beneath resistance
- Bullish progress weakened near the range high
- A meaningful support level broke
- The rebound after the breakdown formed a lower high
- Selling activity expanded during markdown
This suggested that the recovery was being met by sufficient supply.
It did not prove that every rally was deliberately engineered by one participant. It showed that the available demand was unable to gain structural control.
For more detail on how wick behavior, body acceptance, and volume should be read together, see Candles Are Footprints: Reading Liquidity, Volume, and Institutional Intent.
Confirmation
The redistribution thesis required a sequence of confirmation.
1. Failure Above the Range
Price traded through the upper structure but could not maintain acceptance.
This converted the breakout from a bullish possibility into an Upthrust candidate.
It was not yet sufficient for execution.
2. Bearish Displacement
Price moved away from the upper boundary with enough force to challenge internal support.
This indicated more than a minor rejection wick. The market was repricing away from the failed breakout.
3. Meaningful Sign of Weakness
A structurally relevant low was broken.
The importance of the SOW came from the level it violated and the bearish progress that followed—not simply from attaching a Wyckoff label to a red candle.
4. Failed Reclaim
The recovery after the SOW could not regain the former range strength.
This showed that the broken structure was becoming resistance rather than being immediately reclaimed.
5. Last Point of Supply
The lower recovery created a defined LPSY.
This was the point where a conditional bearish thesis could become executable, provided the invalidation and remaining target remained favorable.
6. Acceptance Beneath the Range
The markdown became fully confirmed when price remained beneath the failed structure and continued expanding toward lower liquidity.
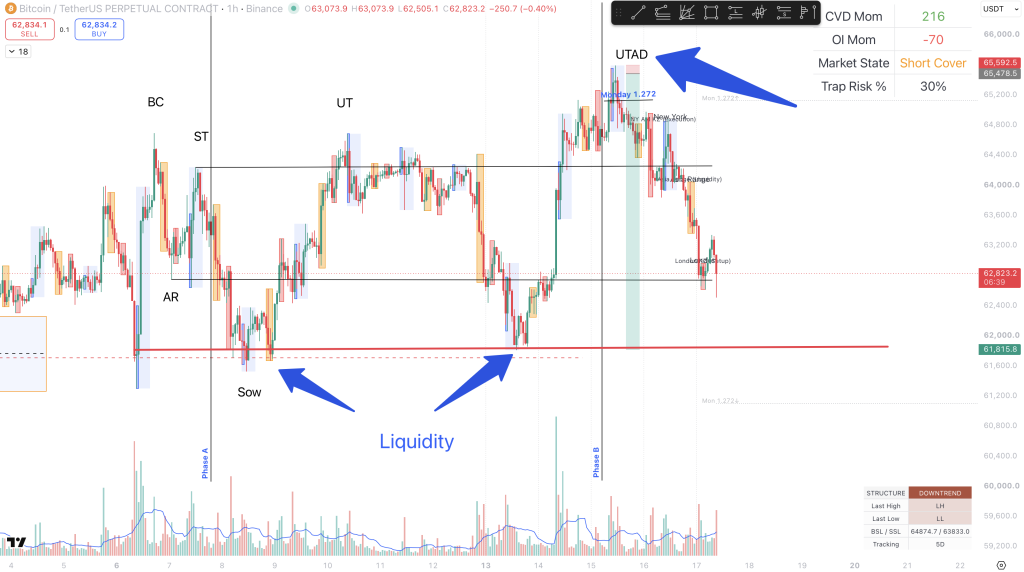
The Upthrust identified the potential trap.
The SOW demonstrated weakness.
The LPSY confirmed that the recovery had failed.
The markdown completed the sequence.
Invalidation and Failure Logic
Invalidation had to be defined before the downside targets.
Redistribution Thesis Invalidation
The bearish redistribution thesis would have weakened or failed if price:
- Reclaimed the SOW with strong bullish displacement
- Moved above the LPSY and maintained acceptance
- Returned above the Upthrust region
- Converted former resistance into support
- Produced a Sign of Strength through the upper range
- Continued forming higher lows above the reclaimed structure
A brief wick above the LPSY would not automatically invalidate the thesis. Sustained acceptance and structural reclaim would.
Accumulation Thesis Invalidation
The competing accumulation thesis weakened when price:
- Failed to produce a valid Sign of Strength
- Broke meaningful range support
- Could not reclaim the broken level
- Formed a lower recovery high
- Expanded beneath the range with increasing bearish participation
This two-sided failure logic was essential.
The correct analytical question was not simply, “Is this redistribution?”
It was:
What evidence confirms redistribution, and what price behavior would prove that interpretation wrong?
The same acceptance-versus-rejection logic is applied in Bitcoin 4H Resistance Zone: Liquidity, Confirmation, and Invalidation.
Execution Condition
The Upthrust itself was not the preferred short entry.
Shorting the first move above resistance would have assumed that the breakout had to fail. A real breakout could have continued and established acceptance above the range.
The more defensible execution sequence was:
- Identify the higher-timeframe bearish environment.
- Mark buy-side liquidity above the range.
- Observe the Upthrust and failure to hold above resistance.
- Wait for bearish displacement.
- Confirm the Sign of Weakness.
- Allow price to retrace.
- Evaluate the LPSY as a potential execution zone.
- Place invalidation beyond the structure that disproves the thesis.
- Target the next opposing sell-side liquidity.
A bearish Fair Value Gap, breaker, supply zone, or premium retracement could refine the entry if clearly visible on the lower timeframe. These tools should support the confirmed structure rather than create the thesis by themselves.
The broader mechanics of executing after a failed breakout are examined in Liquidity Trap Breakout: Confirmation Before Execution.
Harmonic / PRZ Check
No verified harmonic pattern or complete Potential Reversal Zone was documented in the original 6H analysis.
Harmonic geometry was therefore not required to validate the redistribution thesis.
A Fibonacci extension or harmonic PRZ overlapping the Upthrust could have increased the importance of the location. It would not have confirmed the short.
The required evidence would still have been:
- Failed acceptance
- Bearish displacement
- SOW
- Weak reclaim
- LPSY
- Clearly defined invalidation
The harmonic framework remains non-essential for this case study.
MDA D1–D10 Verification
The available evidence supports partial multi-dimensional verification.
Confirmed Dimensions
- Higher-timeframe bearish environment
- 6H recovery range
- Buy-side liquidity above resistance
- Upthrust failure
- SOW through internal support
- Lower LPSY
- Volume expansion during markdown
Partially Documented Dimensions
- Lower-timeframe displacement structure
- Precise Fair Value Gap or Order Block entry
- Session-based execution timing
- Complete D1–D10 alignment
A full D1–D10 verification was not included in the original chart set. It would therefore be inaccurate to claim complete MDA confirmation.
The available dimensions were sufficient to classify the structure after the breakdown, but not to claim perfect alignment across every analytical layer.
Primary Scenario
After the SOW and LPSY, the primary scenario was bearish continuation.
The required sequence was:
- Price remains beneath the broken internal support.
- The LPSY fails to reclaim the prior range.
- Bearish displacement resumes.
- Price accepts beneath the lower boundary.
- Sell-side liquidity below the range becomes the next objective.
The primary scenario was conditional on continued failure below the LPSY.
If price had reclaimed the structure, the bearish thesis would have required reassessment.
Secondary Scenario
The secondary scenario was a failed markdown and structural reclaim.
This required:
- Price stops expanding beneath the range.
- Selling pressure produces limited additional progress.
- The SOW level is reclaimed.
- Price moves through the LPSY.
- Acceptance develops back inside the prior range.
- The market challenges the Upthrust region again.
Under that sequence, the redistribution interpretation would weaken substantially.
The structure could then return to neutral balance or develop into a broader accumulation process.
The later Bitcoin 12H Wyckoff Accumulation Hypothesis provides the opposite analytical problem: a range with constructive absorption evidence but incomplete bullish confirmation.
Target Liquidity
Targets were determined from structural liquidity rather than arbitrary percentage objectives.
Primary Target
The nearest sell-side liquidity beneath the broken range and recent swing lows.
This was the first area where short positions could reduce risk or take partial profit.
Secondary Target
The next external low created during the preceding markdown.
This target remained valid only while price maintained acceptance beneath the range and failed to reclaim the LPSY.
Extended Target
A deeper higher-timeframe liquidity pool could be considered only if:
- Bearish displacement continued
- Rebounds remained weak
- Volume supported the markdown
- No major bullish reclaim developed
A liquidity target is a destination, not automatic confirmation for a new reversal trade.
Risk Assessment
The greatest risk was forcing the Wyckoff interpretation before the range resolved.
A trader who assumed accumulation could have bought the middle of the range without a Spring or Sign of Strength.
A trader who assumed redistribution could have shorted the Upthrust before bearish confirmation and been trapped by genuine breakout acceptance.
Additional risks included:
- Treating the Selling Climax as a confirmed bottom
- Calling every range high an Upthrust
- Ignoring the possibility of accumulation
- Entering before the SOW
- Chasing the initial markdown after the efficient entry passed
- Using the textbook schematic as proof
- Ignoring a reclaim above the LPSY
- Confusing high volume with directional intent
- Holding the bearish thesis after structural invalidation
The value of the Wyckoff framework came from organizing evidence—not from predicting the labels in advance.
No-Trade Conditions
No trade was justified when:
- Price remained in the center of the range
- The Upthrust had not produced structural failure
- The SOW was minor or immediately reclaimed
- The recovery after the SOW remained strong
- No clear LPSY had developed
- Invalidation was too far from the available target
- Volume contradicted the bearish interpretation
- Lower-timeframe structure remained unclear
- The trader had to force labels to justify the entry
Remaining flat during Phase B was a valid professional decision.
The middle of the range offered limited information about control and poor asymmetry relative to both boundaries.
Lessons From the Bitcoin 6H Redistribution
This case study provides several important lessons.
First, a range after a decline is not automatically accumulation.
Second, an Upthrust is not confirmed by the wick alone. Its meaning comes from failed acceptance and the weakness that follows.
Third, the SOW was more important than the first breakout failure because it demonstrated that sellers could violate meaningful support.
Fourth, the LPSY provided a better execution framework than shorting the initial Upthrust. It allowed the bearish thesis to be tested against a clearer invalidation point.
Fifth, volume must be interpreted through effort and result. Large activity without bullish progress can suggest absorption, but the later structural sequence must confirm which side benefited.
Finally, Wyckoff labels should be applied retrospectively as evidence develops. The chart should confirm the schematic—not the other way around.
Expand Your Structural Edge
The Bitcoin 6H range did not begin as confirmed redistribution.
It began as an unresolved structure containing both accumulation and continuation possibilities.
Redistribution became the stronger interpretation only after price failed above the range, produced a meaningful Sign of Weakness, formed a lower Last Point of Supply, and accepted beneath support.
The range defined the problem.
Liquidity created the test.
The Upthrust revealed potential failure.
The SOW confirmed weakness.
The LPSY defined execution and invalidation.
The markdown revealed the result.
For a lower-timeframe application of the same logic, review BTC 30M: Trading the Wyckoff UTAD Trap.
Track the live order flow and volume footprint yourself directly on TradingView.
Leave a Reply