Tag: Wyckoff Logic

  • [Candles]Are Footprints: Reading Liquidity, Volume, and Institutional Intent

    Most retail traders fail because they memorize candlestick patterns like “Hammers” and “Shooting Stars” from a textbook.

    But in real market conditions, a candlestick is rarely just a pattern. It is a footprint of liquidity, order flow, volume, absorption, and structural intent.

    Textbook patterns often appear around areas where retail liquidity is concentrated. That is why traders must stop looking only at the shape of the candle and start asking a deeper question:

    What was the market trying to accomplish with this candle?

    To trade with a structural mindset, we must decode candlesticks through the lens of Liquidity, ICT concepts, and Wyckoff volume logic.

    1. The Wick Is More Than Rejection: It May Be a Liquidity Sweep

    Retail traders are often taught that a long wick represents “price rejection” at support or resistance.

    In structural trading, a wick can mean much more.

    A long wick may be the footprint of a stop hunt, a liquidity sweep, or an absorption event.

    When you see a long lower wick, like a hammer candle, it does not automatically mean buyers stepped in. It may mean price was intentionally driven below a previous structural low to trigger sell-side liquidity.

    Smart money cannot build large positions without liquidity. If they want to buy, they need sellers. By sweeping below a prior low, the market can trigger stop-losses, force breakout sellers into the move, and create the liquidity needed for larger participants to absorb orders.

    Rule: Do not trade a hammer simply because it is a hammer. Trade it only if the wick swept a meaningful liquidity pool and the market shows confirmation afterward.

    2. The Body Shows Intent: Displacement and Acceptance

    If the wick shows where liquidity was attacked, the body shows where price was accepted.

    A large full-bodied candle with little wick often represents strong directional intent. In ICT language, this type of aggressive movement is often described as displacement.

    Displacement is important because it shows that price is not just probing a level — it is repricing away from it.

    A strong-bodied candle breaking through a major structural zone may suggest participation beyond ordinary retail activity. It can also leave behind inefficiencies such as Fair Value Gaps or imbalances.

    But not every breakout is confirmation.

    When a level is broken only by a wick, it may be a trap. When a level is broken by a strong body, followed by acceptance, continuation, or a successful retest, it may signal a meaningful shift in market structure.

    3. The Doji Anomaly: Wyckoff’s Effort vs. Result

    A Doji or Spinning Top is often described as “market indecision.”

    But Wyckoff logic asks a deeper question:

    How much effort was required to produce that result?

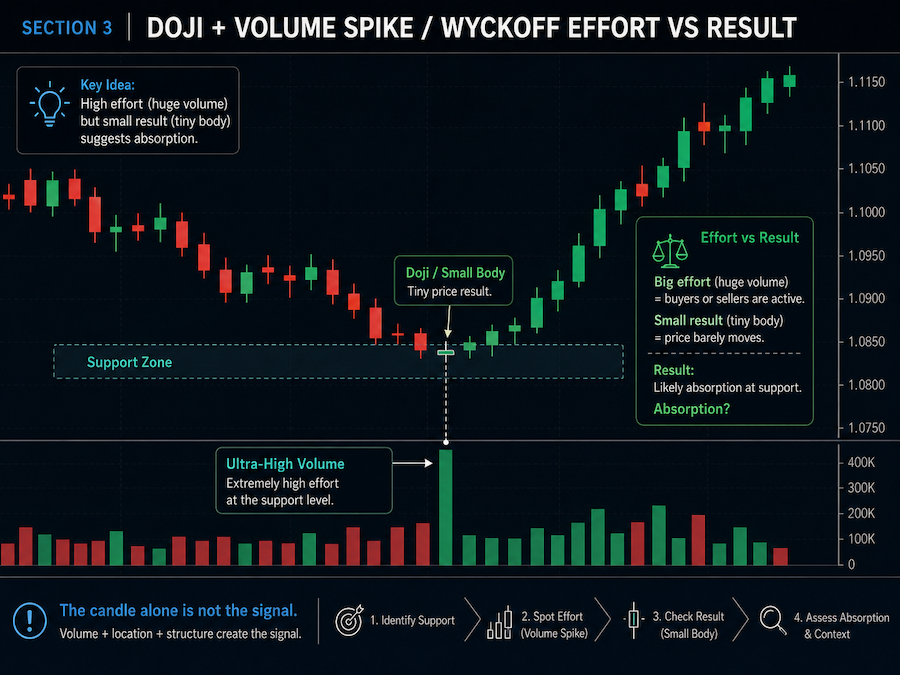
    Imagine a Doji candle forming at a key support level with extremely high volume.

    If volume represents effort, then high volume should normally produce a larger price movement. But if the candle body remains small despite massive volume, something unusual is happening.

    This is the anomaly.

    Large effort with little result may suggest absorption. Aggressive sellers may be hitting the market, but someone on the other side may be absorbing those orders without allowing price to move significantly lower.

    In Wyckoff terms, this is where the relationship between Effort and Result becomes critical.

    The candle itself is not the signal. The relationship between candle size, volume, location, and structure is the signal.

    Conclusion: Never Read a Candle in Isolation

    A candlestick only has meaning when it is read within market structure.

    Before trading any candle pattern, ask three questions:

    1. Did the wick sweep a meaningful liquidity pool?
    2. Did the body show displacement or acceptance?
    3. Does the volume confirm or contradict the price movement?

    A hammer is not automatically bullish.
    A shooting star is not automatically bearish.
    A doji is not automatically indecision.

    Candles are not signals by themselves.

    They are footprints.

    And once you learn to read those footprints through liquidity, volume, and structural intent, you stop trading textbook patterns and start reading the market like a process.

  • [Wyckoff Redistribution] BTC 6 H Smart Money Trap

    Understanding the mechanics of a Wyckoff Redistribution is essential if you have ever experienced the pain of buying a “perfect breakout” only to watch it instantly reverse, or shorting a “confirmed breakdown” right at the exact bottom. You might blame the news, faulty lagging indicators, or simply bad luck.

    But the reality is much colder: You were trapped by the structure. Institutional capital (Smart Money) designs these liquidity traps to fill their massive orders. To avoid becoming their liquidity, you must understand the Wyckoff Logic.

    The Anatomy of a Trap: Wyckoff Redistribution

    Before we dive into a live chart application, we must first decode the institutional blueprint. Below is the textbook schematic of a Wyckoff Redistribution.

    Unlike a sudden market crash, a redistribution phase is a carefully orchestrated campaign. When Smart Money decides to halt a temporary markup to unload their remaining long positions—or to build a massive short inventory—they cannot simply hit the market “sell” button. Doing so would collapse the price prematurely, resulting in severe price slippage and ruining their average execution price.

    Instead, they construct a horizontal trading range. This consolidation creates an illusion of support, tricking retail breakout traders into believing a bullish continuation is imminent. Within this range, the algorithm deliberately engineers fakeouts at the boundaries, systematically sweeping both the Buy-Side Liquidity (BSL) at the highs and the Sell-Side Liquidity (SSL) at the lows.

    The ultimate goal of this schematic is the transfer of risk. It is a highly efficient mechanism designed to transfer holdings from the informed institutional operator to the uninformed retail public. By understanding the specific phases of this Wyckoff schematic, you can identify exactly when the trap is fully set and ready to spring.

    Read our previous analysis: The StructFirst Manifesto

    Wyckoff Redistribution Schematic: The institutional blueprint for trapping retail liquidity.


    Redistribution is a phase where Smart Money halts a temporary rally to unload their remaining positions before driving the price lower. It consists of specific phases:

    • Phase A (Stopping the Trend): The initial buying climax and automatic reaction establish the trading range.
    • Phase B (Building the Cause): The market chops sideways. This is where retail traders are chopped up, and Smart Money secretly builds their short positions.
    • Phase C (The Trap): The Upthrust (UT). Price breaks above the resistance, triggering retail breakout buyers and hunting stop-losses. This is the ultimate trap.
    • Phase D & E (The Markdown): Price breaks back into the range, shows Signs of Weakness (SOW), and prints Last Points of Supply (LPSY) before the structural breakdown.

    Structure in Action: BTC 6H Chart Analysis

    Theory is useless without practical application. Let’s look at how this exact schematic played out on the recent Bitcoin 6-Hour chart.

    Wyckoff Redistribution Schematic
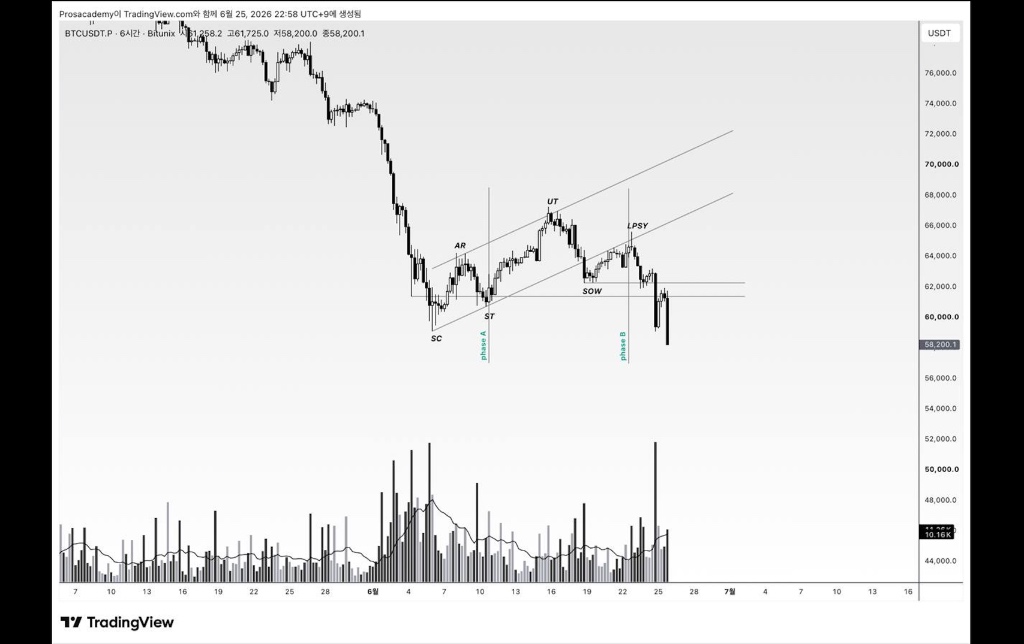
    Structure in Action: BTC 6H Redistribution trapping retail breakouts

    .

    Notice how the live chart perfectly mirrors the textbook schematic:

    1. Phase A: The Selling Climax (SC) and Automatic Rally (AR) defined our initial structural range. The Secondary Test (ST) confirmed the boundaries.
    2. The Upthrust (UT): Look at the UT at the top of the channel. To a retail trader using moving averages, this looked like a confirmed bullish breakout. But structurally, it was an Upthrust—a liquidity sweep designed to trap late buyers.
    3. Sign of Weakness (SOW) & LPSY: After the trap, the price slammed back into the range, breaking local support (SOW). The subsequent bounce to the LPSY (Last Point of Supply) was the high-probability structural entry for a short position, offering an excellent Risk-to-Reward ratio.

    Look at the volume profile at the bottom. As the price pushed higher toward the UT, the buying volume was visibly drying up (divergence). The effort to push the price up yielded no genuine result.

    Conclusion: Confirmation Over Assumption

    A sweep is not automatically a reversal, and a breakout is not automatically a trend continuation. Do not force Wyckoff labels, but use them to understand who is in control.

    Stop trading the breakout. Start trading the structure.

  • The StructFirst Manifesto: Why Market Structure Precedes Everything

    Welcome to StructFirst.

    Welcome to StructFirst. If you are a retail trader, you must understand that Market Structure precedes everything else. You have likely experienced the frustration of buying a “perfect breakout” only to watch it instantly reverse, or shorting a “confirmed breakdown” right at the exact bottom. You might blame the news, faulty indicators, or bad luck.

    But the reality is much colder: You were trapped by the structure.

    The financial market is not a random walk. It is a highly engineered battlefield where institutional capital (Smart Money) and trading algorithms design liquidity traps to fill their massive orders. They leave footprints, and those footprints are not found in lagging indicators like RSI or MACD.

    They are found in Market Structure.

    What Does “Structure First” Mean?

    “Structure First” is more than just a name; it is the core philosophy of this blog and my trading approach. Before looking at moving averages, before reading the news, and before taking any trade, we must define the structural framework of the chart.

    Market Structure
    Time and Price – Understanding algorithmic liquidity delivery across Asian, London, and NY sessions.

    1. The HTF Narrative (Higher Timeframe): Who is in control? Are we in an accumulation phase preparing for a markup, or a distribution phase preparing for a markdown?
    2. Liquidity Engineering & Inducement: Where are the retail stop-losses resting? Markets move from one liquidity pool to another. We must identify where Smart Money is engineering a trap (such as a Wyckoff Upthrust or an ICT Liquidity Sweep) to fuel their real moves.
    3. The LTF Execution (Lower Timeframe): Once the HTF structure is defined, we zoom in to find the exact structural shifts (Market Structure Shift / Change of Character) to enter precisely with institutional order flow.

    What Does "Structure First" Mean?

    Structure First means we never predict direction first; we define the structural boundaries of the battlefield. However, market structure is not a single line on an isolated chart—it is a deeply fractal mechanism. This is why our framework relies on rigorous D1 to D10 Multiple Timeframe Analysis (MDA). A lower timeframe breakout is nothing but institutional noise if it contradicts the D10 structural narrative. We must continuously verify the higher timeframe intent before committing to any execution.

    Furthermore, this overarching structural context is exactly where Harmonic Patterns become powerful. A Potential Reversal Zone (PRZ) is entirely useless in a vacuum. We do not trade a geometric pattern blindly just because a Fibonacci ratio is hit. Instead, we trade the structural confirmation at the PRZ. When a Harmonic PRZ perfectly aligns with a higher timeframe liquidity sweep and demonstrates confirmed institutional intent, the execution becomes a high-probability setup. Structure dictates the ‘where’, and structural confirmation dictates the ‘when’. Remember: Confirmation is always more important than assumption.

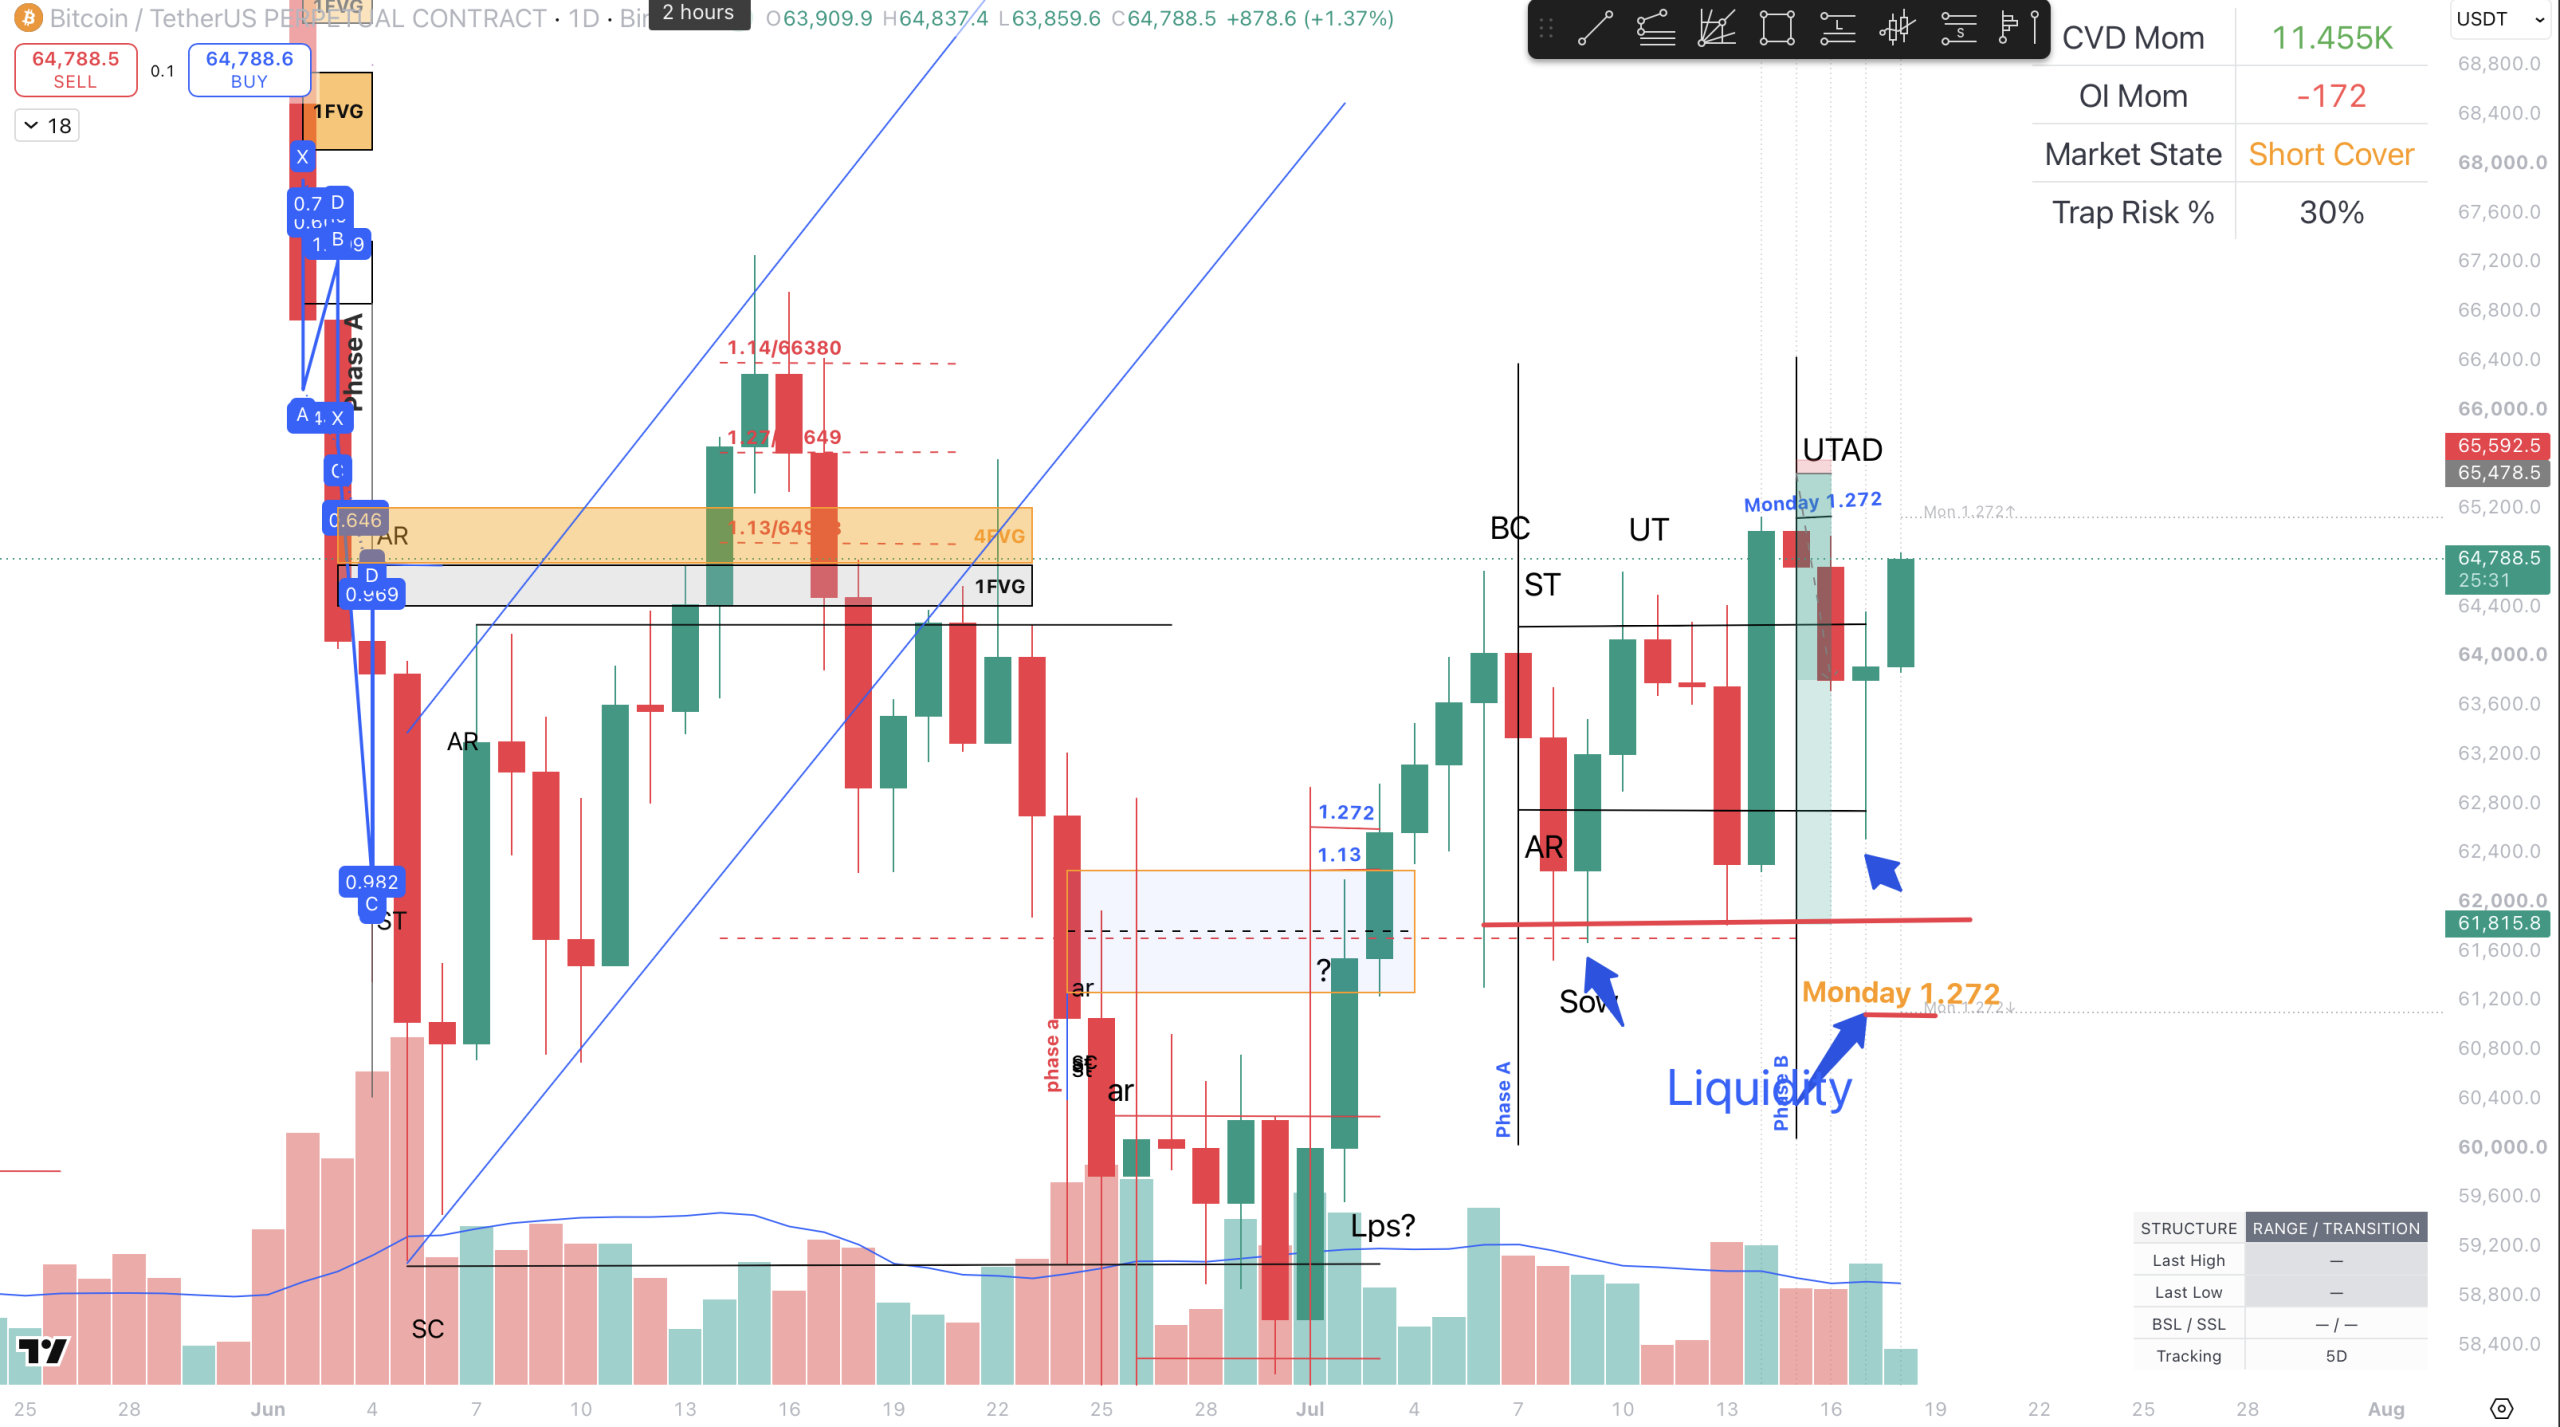
    Structure in Action – A textbook Wyckoff Redistribution trapping retail breakouts.

    TradingView

    What to Expect from StructFirst

    This blog is a live journal and a structural trading manual. Here, you will not find “get rich quick” signals or cluttered charts with ten different indicators. Instead, we will focus on:

    • ICT (Inner Circle Trader) Concepts: Decoding algorithmic price delivery, Time & Price (Killzones), Fair Value Gaps (FVG), Order Blocks, and Buy/Sell-side Liquidity.
    • Wyckoff Logic: Understanding the macro accumulation and distribution phases of the “Composite Man.”
    • Harmonic Patterns: Identifying high-probability reversal zones (PRZ) within the larger structural context.
    • Live Chart Breakdowns: Applying these theories to real-time crypto and macro charts.
    • Trading Psychology: Structuring your mindset to trade like an institution, not a gambler.

    Indicators lag. News deceives. But structure is absolute.

    If you are ready to stop chasing retail illusions and start reading the true intentions of the market, you are in the right place. Let’s decode the structure together.

    Welcome to StructFirst.