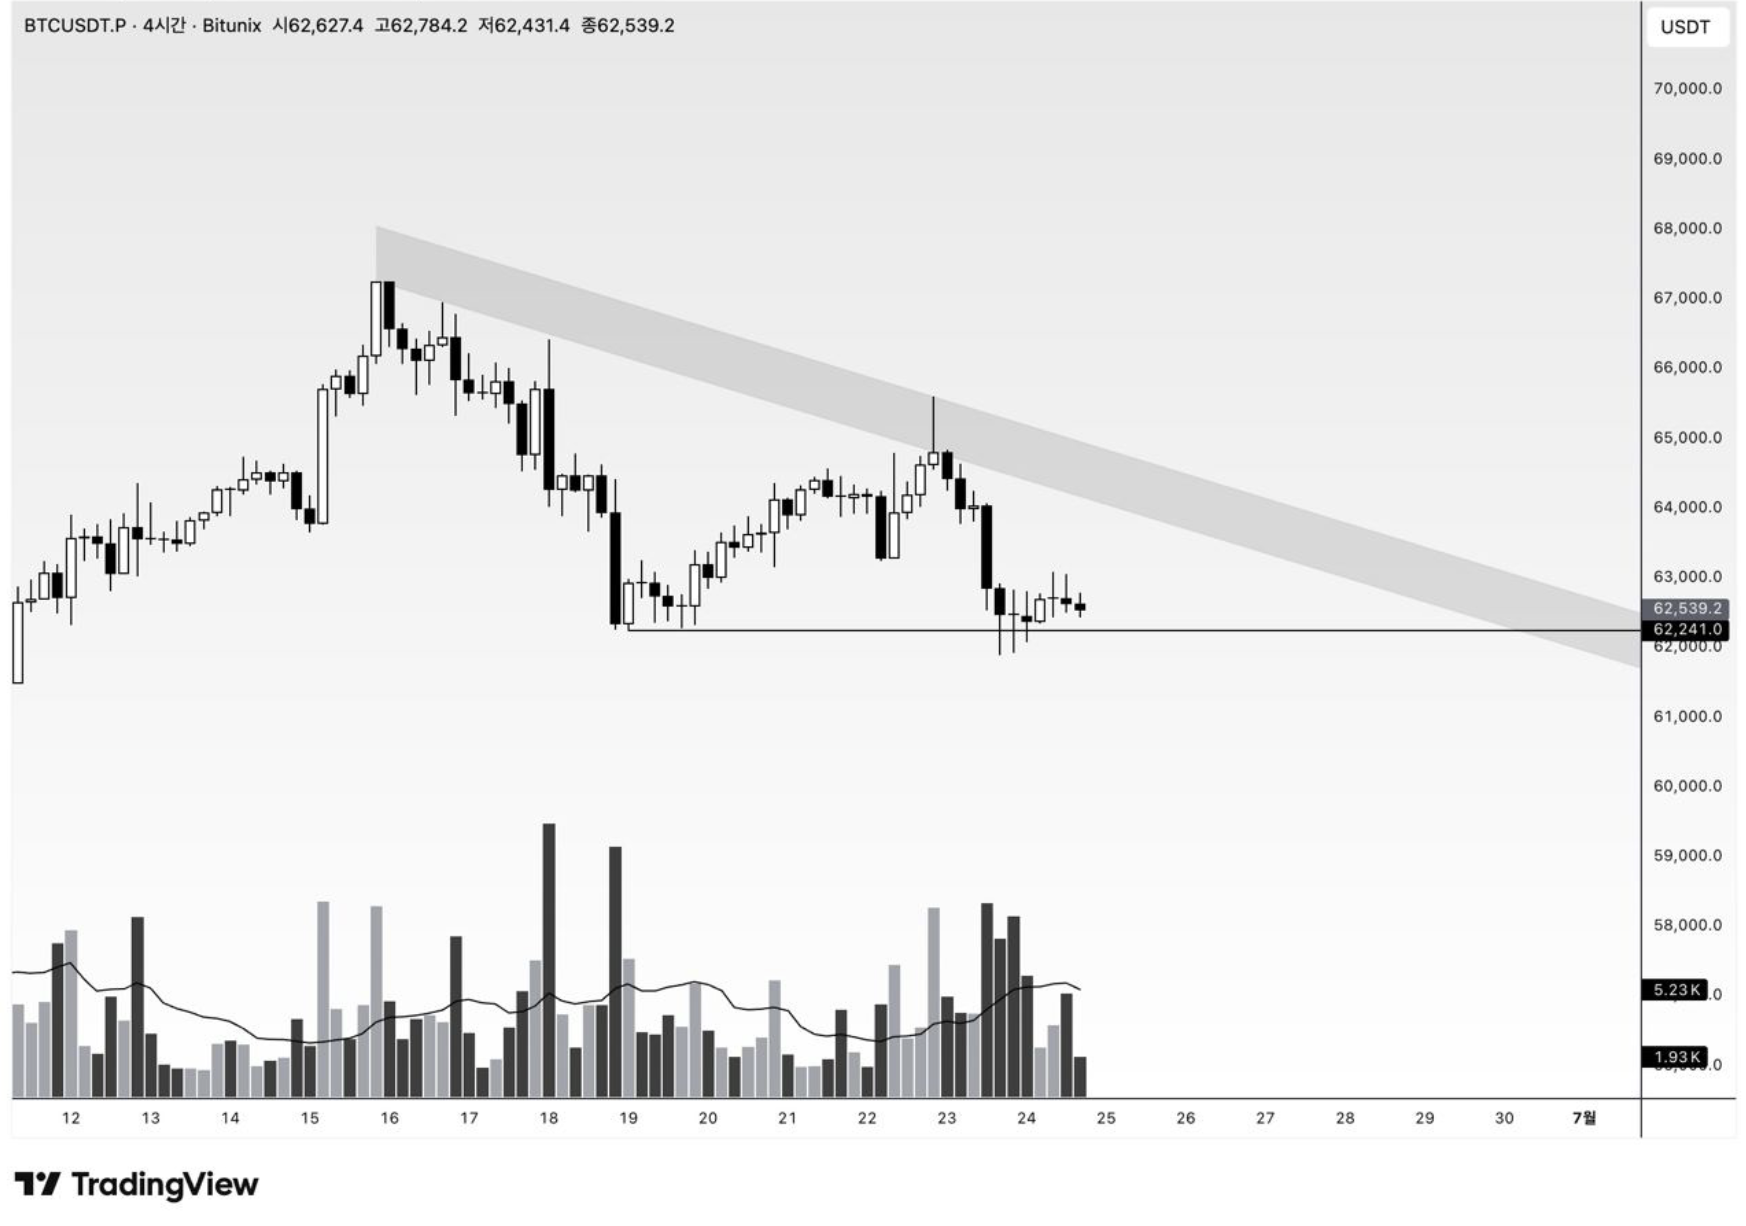
A resistance zone is not automatically a short signal.
It is a structural location where the market must reveal whether supply remains active or whether sufficient demand exists to reprice above the area. The zone identifies where the decision may develop. It does not determine the outcome in advance.
That distinction defined the Bitcoin 4-hour structure examined in this research note.
Price was compressing beneath a broad resistance area that aligned with higher-timeframe supply. Several upper-wick reactions suggested that sellers remained active, but the market had not yet produced enough evidence to confirm either a sustained breakout or a completed bearish reversal.
The central problem was therefore not simply that Bitcoin had reached resistance. It was that both breakout buyers and anticipatory short sellers were being asked to commit risk before the market had confirmed acceptance or rejection.
This case study follows the StructFirst analytical sequence:
HTF Structure → Liquidity → Intent → Confirmation → Failure Logic → Execution → Risk Management
The objective is not to prove that Bitcoin had to move lower. It is to demonstrate how a trader could evaluate the resistance zone without allowing directional expectation to replace confirmation.
For the broader philosophy behind this process, read Why Market Structure Comes First: The StructFirst Trading Framework.
Key Structural Problem
The key structural problem was the width and location of the 4H resistance zone.
Price was not approaching a thin horizontal line that could be considered broken after a minor wick. It was trading beneath a broader area where previous transactions, trapped positions, pending breakout orders, and potential supply overlapped.
This distinction matters because broad resistance zones require evidence of acceptance—not merely temporary penetration.
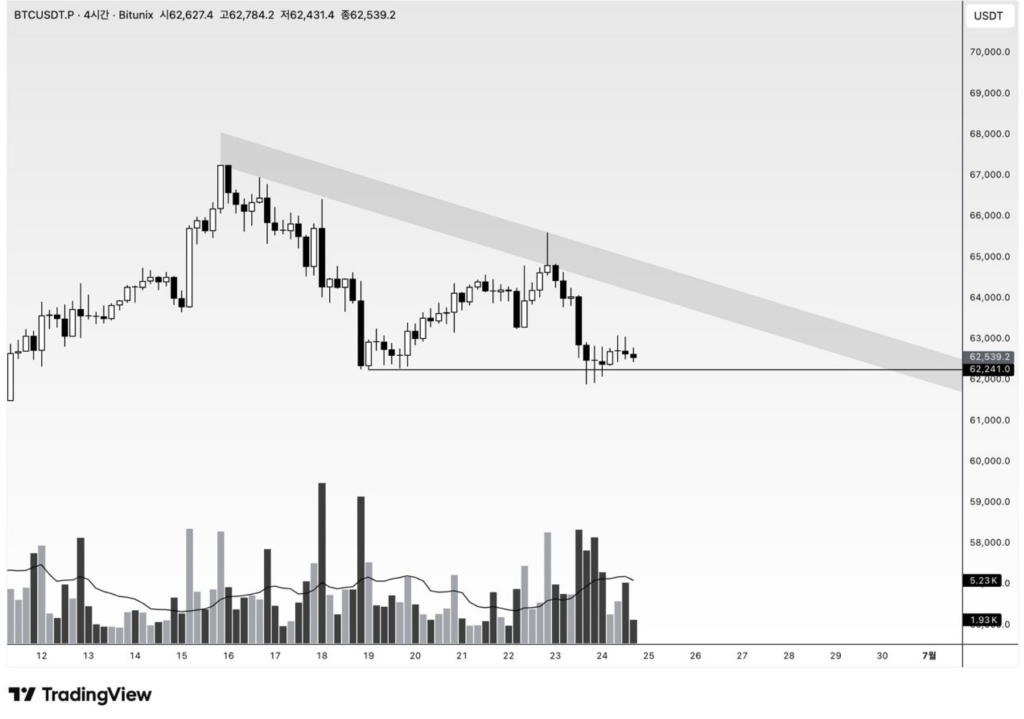
The structure created three important execution problems:
- A brief move into or above the zone would not confirm a breakout.
- An upper wick would not independently confirm a reversal.
- Trading from the middle of the consolidation would provide weak structural invalidation.
Price was compressing beneath the upper boundary, but compression does not predict the direction of expansion.
Repeated tests can weaken resistance as available supply is absorbed. The same tests can also allow larger sellers to distribute into persistent demand. The chart therefore required a conditional plan rather than a predetermined bearish conclusion.
Confirmed Observation
Bitcoin was trading beneath a defined 4H resistance area and had produced visible reactions near the upper boundary.
Structural Inference
Supply appeared to remain active because price had not demonstrated sustained candle-body acceptance above the zone.
Unconfirmed Possibility
A sweep of buy-side liquidity followed by lower-timeframe bearish displacement could create a short setup.
Alternatively, a decisive close and successful retest above the zone could confirm that demand had absorbed the available supply.
These categories must remain separate.
An observation describes what the chart visibly shows. An inference interprets that evidence. A possibility describes what may develop but has not yet been confirmed.
HTF Structure
The 4H resistance zone should not be evaluated in isolation.
The area aligned with a broader Daily structure where price had previously encountered supply. That overlap increased the structural importance of the zone, but it did not guarantee that sellers would continue controlling it.
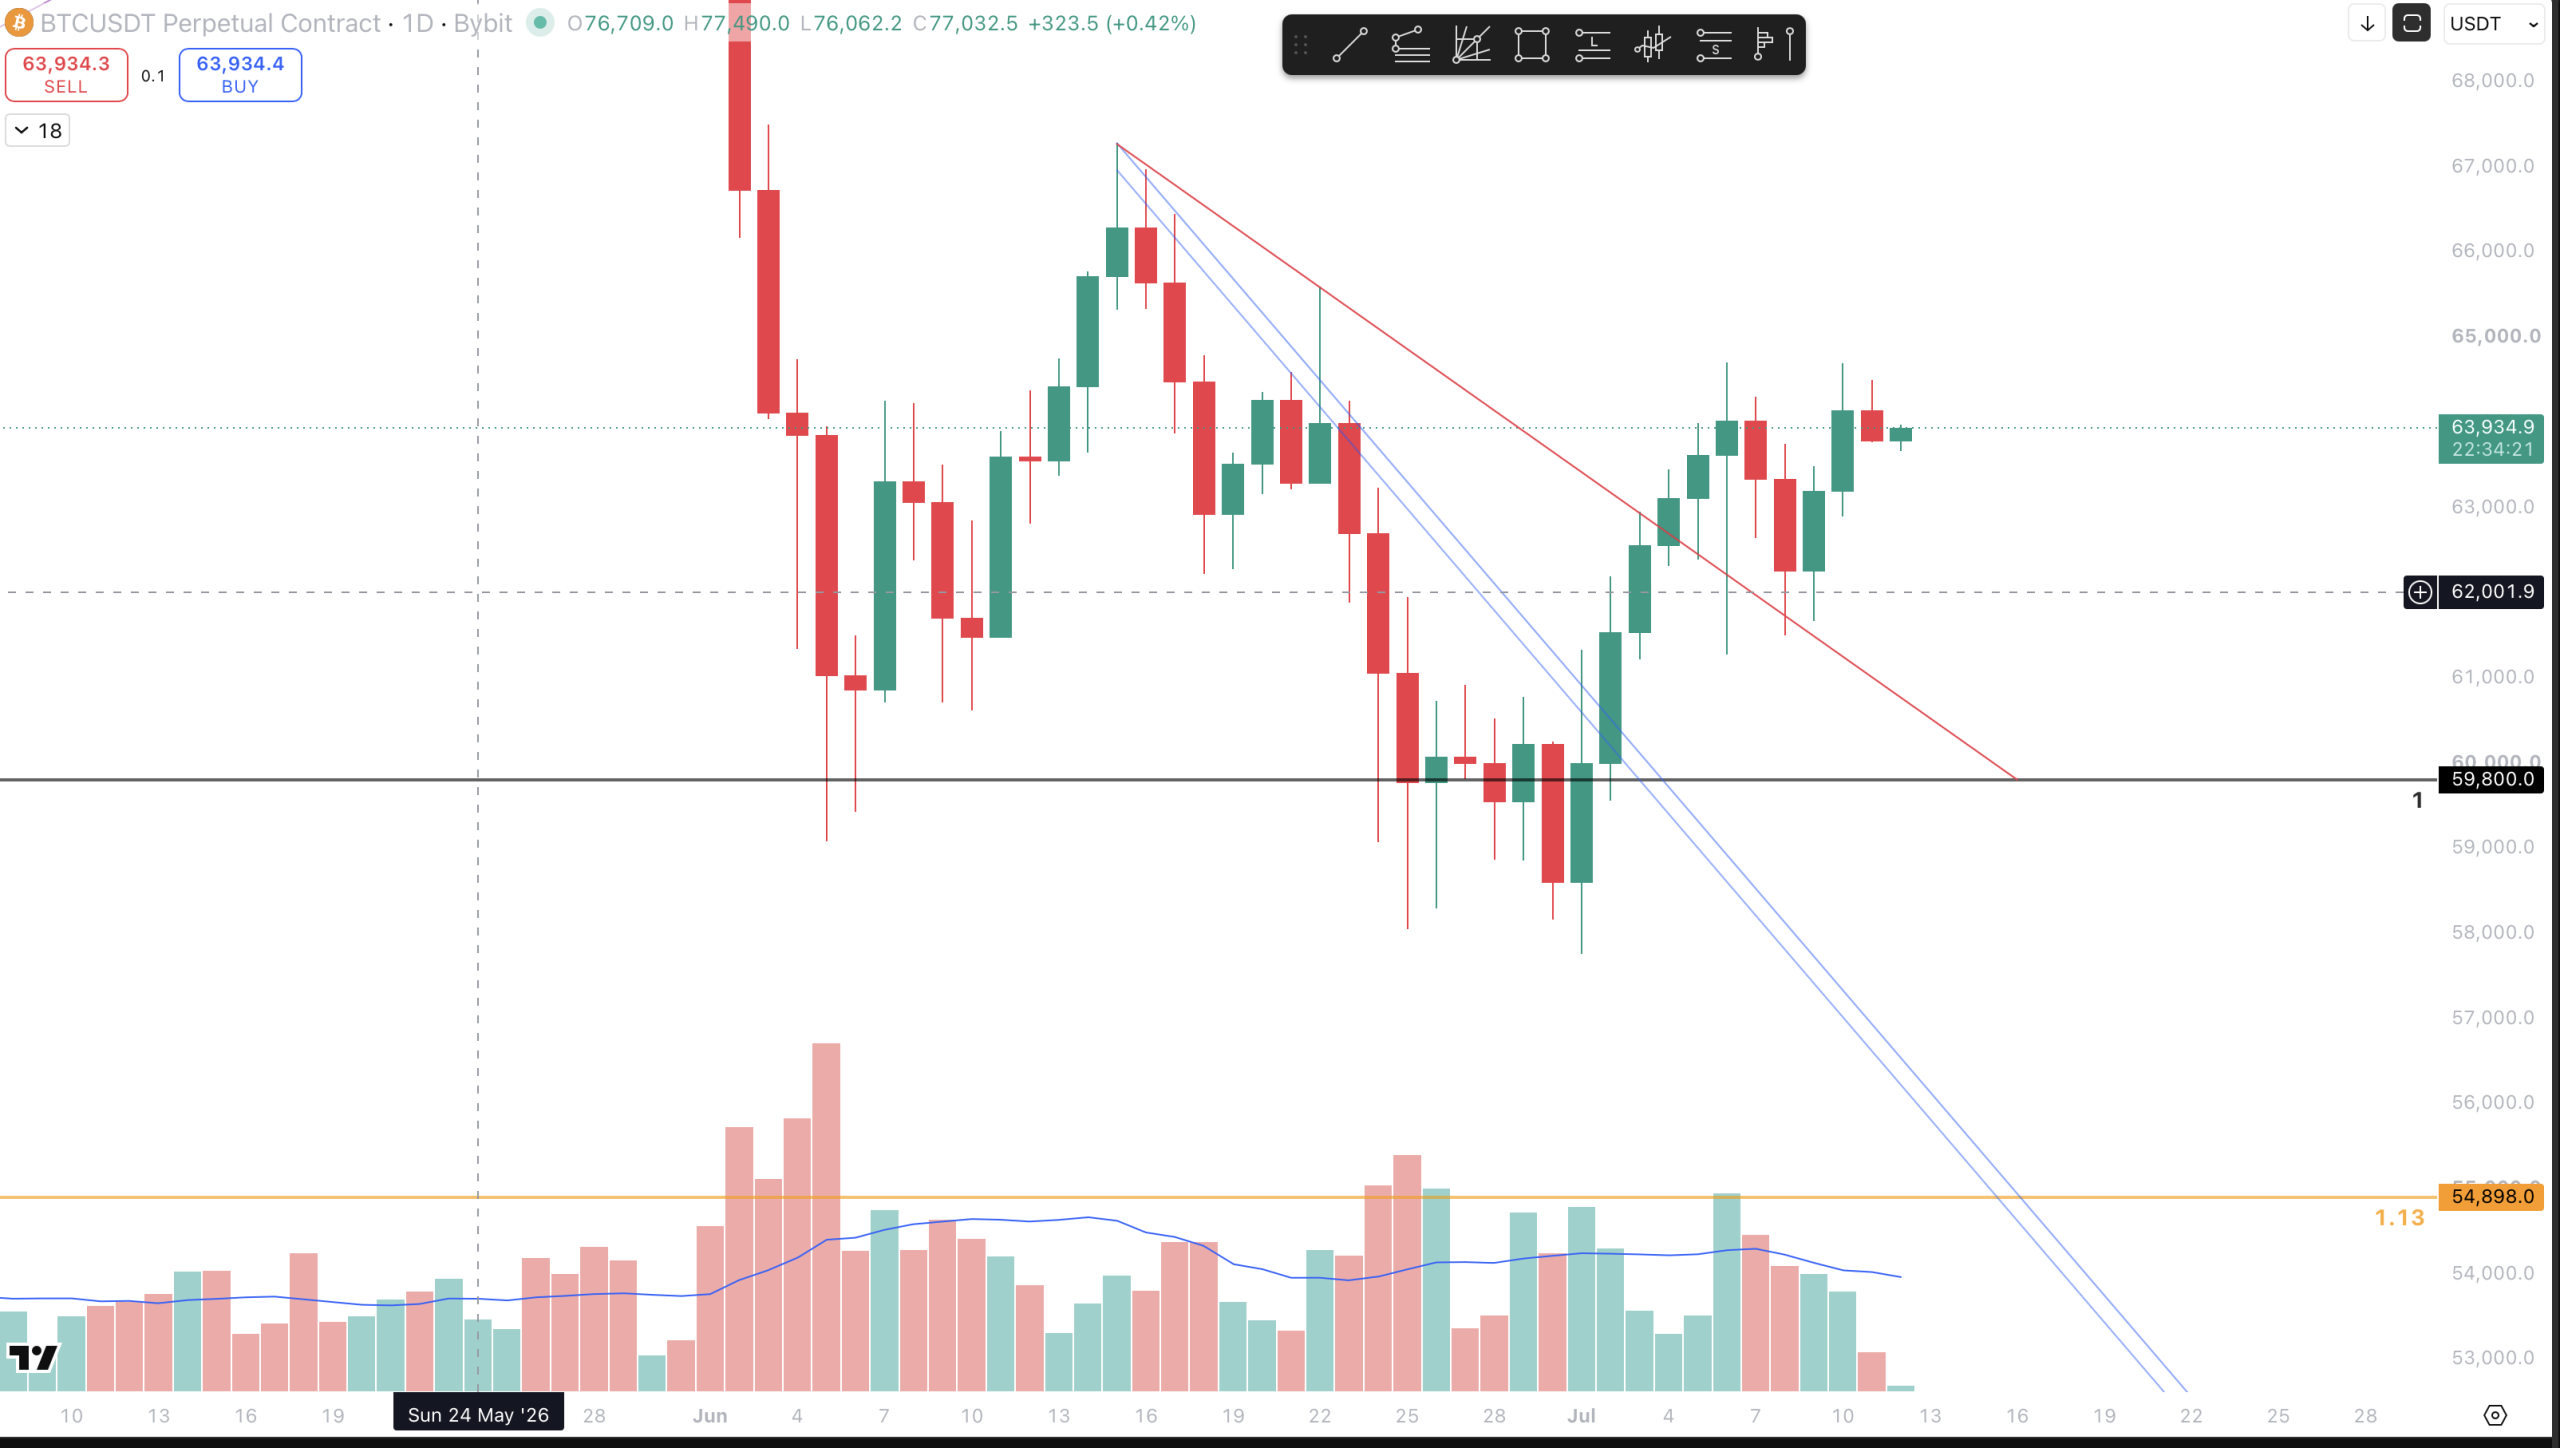
A higher-timeframe supply area identifies a location where the market previously failed to sustain higher prices. It does not prove that the same result must occur during every future test.
The controlling structure presented two competing conditions.
First, Daily overhead supply remained relevant because price had not yet established clear acceptance above the broader resistance area.
Second, the 4H market was compressing near the boundary rather than immediately rejecting from it. This suggested that demand continued testing the zone, even though it had not yet demonstrated control.
The professional response was not to short automatically because price had entered resistance.
The correct response was to define:
- What would confirm that supply still controlled the zone
- What would invalidate the bearish rejection thesis
- What would confirm genuine acceptance above resistance
- Whether the available target justified the required invalidation distance
Higher-timeframe structure defined the location. Lower-timeframe behavior would determine whether the location became executable.
Liquidity Positioning
The resistance area mattered partly because of the liquidity positioned around it.
Buy-Side Liquidity
Buy-side liquidity was likely concentrated above the visible upper boundary and recent local highs.
That liquidity could include:
- Stop-loss orders from existing short positions
- Buy-stop orders from breakout traders
- Momentum entries triggered above the range
- Remaining orders around previous swing highs
A move above resistance could therefore serve two different structural purposes.
Price could trade above the highs to access available liquidity before failing back into the range. Alternatively, it could clear the liquidity and establish genuine acceptance above the zone.
The sweep itself would not distinguish between those outcomes.
The market’s response after the sweep would provide the more important evidence.
Sell-Side Liquidity
Sell-side liquidity was positioned beneath the recent local lows formed during the 4H consolidation.
This area could contain:
- Stop-loss orders from range longs
- Sell-stop breakout orders
- Liquidity beneath repeated support tests
- Profit objectives for confirmed short positions
If the resistance zone produced a confirmed bearish rejection, these local lows would become logical structural objectives.
They were not targets because price was expected to fall automatically. They were targets because identifiable orders were likely resting beneath the range.
Internal Liquidity
Liquidity also existed inside the consolidation.
Minor highs, minor lows, and short-term imbalances could generate repeated intraday movement without resolving the larger structure. This made the middle of the range a poor location for directional execution.
A complete explanation of why accessing liquidity is not the same as confirming a reversal is available in What Is a Liquidity Sweep? Confirmation, Failure, and Execution.
Wyckoff and ICT Context
The chart could be evaluated through both Wyckoff and ICT concepts, but neither framework should be forced before the market produced supporting evidence.
If price traded above the local highs, accessed buy-side liquidity, and then failed back beneath resistance, the movement could later be interpreted as:
- A Wyckoff Upthrust or UTAD-type event
- An ICT Turtle Soup setup
- A failed breakout
- A local distribution event
The label would only become useful after failure had been confirmed.
A wick above resistance would not be enough.
A meaningful failure sequence would require evidence such as:
- Inability to remain above the swept highs
- Acceptance back inside the prior range
- Bearish displacement away from resistance
- Violation of a structurally meaningful lower-timeframe low
- A failed retest beneath the broken structure
Without those elements, calling the movement a UTAD or liquidity trap would be premature.
The related case study Bitcoin Wyckoff Redistribution: How the 6H Structure Confirmed Markdown shows why an Upthrust becomes actionable only when subsequent weakness and structural failure support the label.
Intent
Institutional intent cannot be directly observed.
It must be inferred from the relationship between location, volume, candle behavior, displacement, and acceptance.
The 4H resistance zone presented two competing interpretations.
Supply-Controlled Interpretation
Supply remained the controlling force if price repeatedly entered the resistance zone but failed to produce sustained body closes above it.
Evidence supporting that interpretation would include:
- Upper wicks followed by weak closes
- Increased buying effort with limited upward progress
- Failure to remain above local highs
- Bearish displacement after accessing buy-side liquidity
- Continued acceptance beneath the upper boundary
This would suggest that buying pressure was being absorbed or met by sufficient opposing supply.
It would remain an inference until the market confirmed the interpretation through structural failure.
Demand-Controlled Interpretation
Demand was gaining control if price began closing through the resistance area rather than merely wicking into it.
Evidence supporting that interpretation would include:
- Full-bodied 4H closes above the upper boundary
- Limited immediate rejection
- Continued trading above former resistance
- A successful retest of the broken zone
- Expansion toward the next external liquidity objective
The important question was not whether the resistance zone looked strong.
The question was whether the market accepted or rejected prices beyond it.
Confirmation
Confirmation was required for both the bearish and bullish scenarios.
Bearish Confirmation
A short setup required more than contact with resistance.
The preferred bearish sequence was:
- Price trades into or above the 4H resistance zone.
- Buy-side liquidity above the local highs is accessed.
- Price fails to maintain acceptance above the zone.
- Bearish displacement moves price away from resistance.
- A meaningful 15-minute or 30-minute swing low is broken.
- A retracement fails beneath the broken structure or returns to a valid premium execution area.
This sequence would convert the resistance area from a general location into a defined bearish setup.
The wick identifies where price traded. The candle body and subsequent displacement reveal whether those prices were accepted or rejected.
This distinction is examined in greater detail in Candles Are Footprints: Reading Liquidity, Volume, and Institutional Intent.
Bullish Confirmation
A bullish breakout required more than a brief move above the resistance box.
The preferred bullish sequence was:
- A full-bodied 4H candle closes above the upper boundary.
- Price continues trading above the zone instead of immediately returning inside.
- Former resistance is tested and holds as support.
- Lower-timeframe structure forms a higher low above the reclaimed area.
- Expansion resumes toward the next buy-side liquidity pool.
A candle close without continued acceptance would remain incomplete confirmation.
A breakout followed by immediate failure could instead become the liquidity event required for the bearish scenario.
Confirmation therefore had to include both the initial break and the market’s behavior after the break.
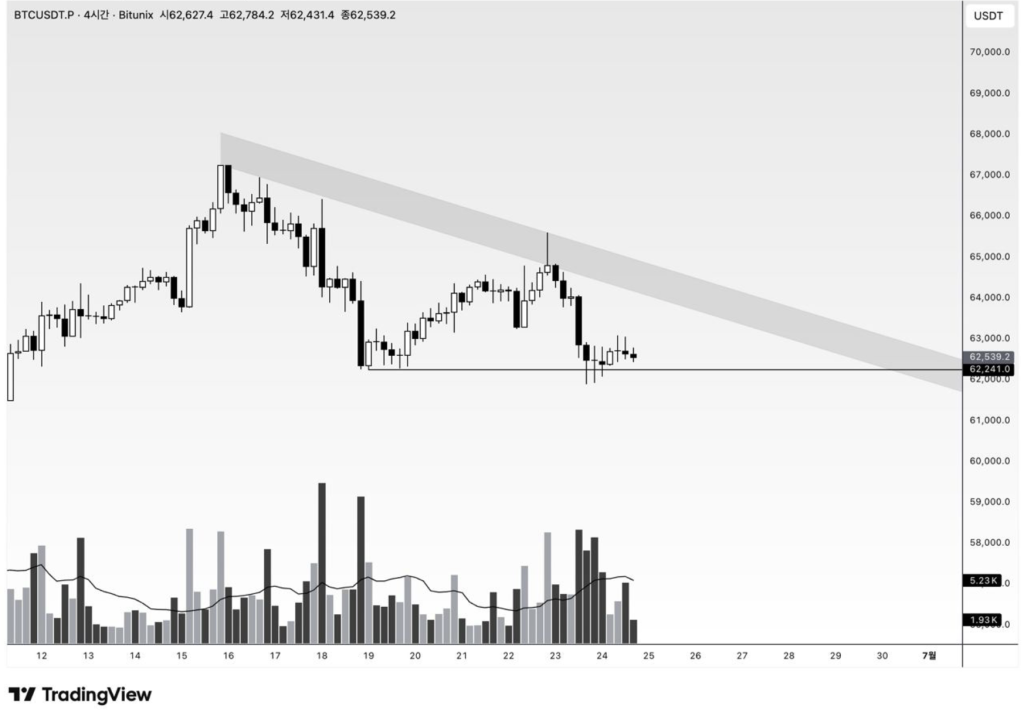
The structural difference is simple:
The sweep is the event. Acceptance or rejection determines the trade.
Invalidation and Failure Logic
Invalidation must be defined before targets.
Bearish Thesis Invalidation
The bearish rejection thesis would be invalidated if price:
- Closed decisively above the resistance zone
- Maintained acceptance above the upper boundary
- Converted the former supply area into support
- Invalidated the bearish displacement structure
- Continued forming supportive higher lows above the zone
If the market accepted above resistance, the supply-controlled interpretation would no longer be valid.
A trader should not continue holding a short solely because the area had functioned as resistance in the past.
The correct term is bearish rejection thesis or supply-controlled thesis. It should not be described as a bearish accumulation thesis.
Bullish Thesis Invalidation
The bullish breakout thesis would fail if price:
- Broke above resistance but immediately returned inside the range
- Failed to hold former resistance as support
- Produced bearish displacement beneath the breakout structure
- Broke the lower-timeframe swing supporting the breakout
- Converted the breakout into a liquidity trap
This two-sided invalidation prevents the analysis from becoming permanently attached to one directional opinion.
The market is not required to respect the original thesis. The thesis must adapt when the market disproves it.
Execution Condition
Execution should occur only after the structure moves from possibility to confirmation.
Conditional Short Execution
A short position becomes actionable only after:
- Buy-side liquidity is accessed
- Price fails to remain above resistance
- Bearish displacement confirms rejection
- Relevant lower-timeframe structure breaks
- A retracement provides defined and efficient risk
The position should not be entered merely because price touches the resistance zone.
A structurally efficient entry may appear during a retracement into a bearish Fair Value Gap, breaker, supply zone, or the origin of the displacement. These execution tools should only be used if they are clearly present on the chart.
The stop belongs beyond the structure that disproves the rejection thesis—not at an arbitrary percentage distance.
Conditional Long Execution
A long position becomes actionable only after:
- Price closes above the resistance zone
- Acceptance is sustained
- The former upper boundary holds during a retest
- Lower-timeframe demand structure remains intact
- Sufficient target liquidity remains above the entry
The long thesis would be based on acceptance rather than on chasing the first breakout candle.
For a broader case study on the difference between a level break and genuine acceptance, read Liquidity Trap Breakout: Confirmation Before Execution.
Harmonic and PRZ Check
No verified harmonic completion or clearly defined Potential Reversal Zone was documented in the original 4H resistance analysis.
A harmonic label should therefore not be added simply to increase apparent confluence.
If a valid harmonic PRZ overlapped with the resistance zone, it could strengthen the importance of the location. It would still not confirm a reversal.
Price would need to demonstrate rejection, displacement, structural failure, and failure to regain acceptance above the PRZ.
For this case study, the harmonic framework remains non-confirming and non-essential.
MDA D1–D10 Verification
The available charts support a partial multi-timeframe framework:
- Daily: Higher-timeframe supply and broader structural context
- 4H: Primary resistance zone and consolidation structure
- 30M–15M: Potential confirmation and execution structure
A complete D1–D10 verification was not documented in the original analysis. It would therefore be inaccurate to claim complete multi-dimensional alignment.
The available hierarchy was still sufficient to establish the decision process:
- The higher timeframe defined the location.
- The 4H chart defined the structural problem.
- Lower timeframes were required to confirm execution.
This represents partial MDA alignment, not a completed D1–D10 signal.
Primary Scenario
The primary working scenario was a failed attempt to move through the 4H resistance zone.
The required sequence was:
- Price tests or sweeps liquidity above the upper boundary.
- The market fails to maintain acceptance above resistance.
- Bearish displacement breaks meaningful lower-timeframe structure.
- A retracement fails beneath the resistance area.
- Price rotates toward internal liquidity and then the sell-side liquidity beneath the range.
This was a conditional bearish scenario.
It was not a prediction that resistance had to hold.
Until the liquidity event and structural failure occurred, there was no confirmed short setup.
Secondary Scenario
The secondary scenario was genuine breakout acceptance.
This required:
- A decisive 4H body close above the zone
- Continued trading above former resistance
- A successful structural retest
- Higher lows forming above the reclaimed boundary
- Expansion toward the next external buy-side liquidity objective
If these conditions developed, the bearish rejection thesis would be invalidated.
The former resistance area would no longer represent the preferred short location. It would instead become a potential support reference within the newly accepted structure.
The professional response would be to abandon the failed bearish thesis and reassess the chart from the new structural environment.
Target Liquidity
Targets should be based on identifiable liquidity and structural levels rather than arbitrary percentages.
Bearish Targets
For a confirmed bearish rejection:
- Primary target: Internal liquidity at the nearest meaningful local low
- Secondary target: Sell-side liquidity beneath the broader consolidation
- Extended target: A lower higher-timeframe liquidity pool only if 4H weakness continued
The first target could be used to reduce risk or take partial profit.
Any remaining position would require active management because reaching the first liquidity pool could produce a reaction without reversing the larger structure.
Bullish Targets
For a confirmed breakout and successful retest:
- Primary target: The next visible swing high above resistance
- Secondary target: External buy-side liquidity beyond the higher-timeframe range
- Extended target: A higher structural objective only while acceptance and displacement remained intact
A liquidity target is a destination—not a new entry confirmation.
Reaching a target does not independently justify reversing direction.
Risk Assessment
The greatest risk in this structure was anticipation.
A trader who shorted the first contact with resistance could be trapped by genuine acceptance above the zone.
A trader who bought the first move above the boundary could be trapped by a failed breakout and return into the range.
Additional risks included:
- Entering from the middle of the consolidation
- Treating an upper wick as completed bearish confirmation
- Promoting a minor CHoCH into a confirmed higher-timeframe reversal
- Ignoring sustained acceptance above resistance
- Using arbitrary stops instead of structural invalidation
- Forcing Wyckoff or harmonic labels
- Chasing displacement after the efficient entry had already passed
- Holding a failed thesis after the market changed structure
The resistance zone provided useful information, but it did not remove uncertainty.
Its value came from defining where the market had to prove intent and where each scenario would fail.
No-Trade Conditions
No trade was justified when:
- Price remained compressed in the middle of the range
- Neither external liquidity pool had been accessed
- A rejection occurred without meaningful displacement
- A breakout occurred without acceptance or a successful retest
- Lower-timeframe structure remained noisy or contradictory
- The invalidation distance created poor reward relative to the next target
- Volume and candle behavior failed to clarify intent
- The trader had to assume the outcome rather than observe confirmation
No-trade was not a missed opportunity.
It was the correct professional decision while the market remained structurally unresolved.
Lessons From the Bitcoin 4H Resistance Zone
This case study reinforces several StructFirst principles.
First, resistance is a location—not a complete trade thesis.
Second, a wick through resistance proves only that the market traded through the level. It does not prove whether liquidity was accessed for reversal or accepted for continuation.
Third, higher-timeframe context determines why a zone matters, while lower-timeframe confirmation determines whether the location becomes executable.
Fourth, invalidation must be defined before targets. A thesis that cannot clearly explain how it fails is not ready for execution.
Fifth, institutional intent should be treated as an inference based on visible evidence—not as something the analyst can know with certainty.
Finally, the middle of a compressed range rarely provides the same clarity as its boundaries. Waiting for liquidity, displacement, and confirmation produces fewer trades, but it also creates more clearly defined risk.
Expand Your Structural Edge
The Bitcoin 4H resistance zone was useful because it created a clear decision boundary.
It did not instruct traders to short automatically. It showed where the conflict between supply and demand was concentrated, where liquidity was positioned, and what evidence would confirm either rejection or acceptance.
A practical lower-timeframe application of this logic can be found in UTAD Short Setup: Structural Trading and Trap Execution, where a buy-side liquidity event required subsequent structural failure before becoming executable.
The zone defined the location.
Liquidity created the event.
Confirmation defined the trade.
Invalidation controlled the risk.
Track the live order flow and volume footprint yourself directly on TradingView.
Leave a Reply