When retail traders see a resistance breakout, they instinctively hit the buy button. When Smart Money (institutional capital) sees that same breakout, they view it as the perfect liquidity pool to fill their massive orders. We do not predict breakouts; we trade the structural footprints left behind.
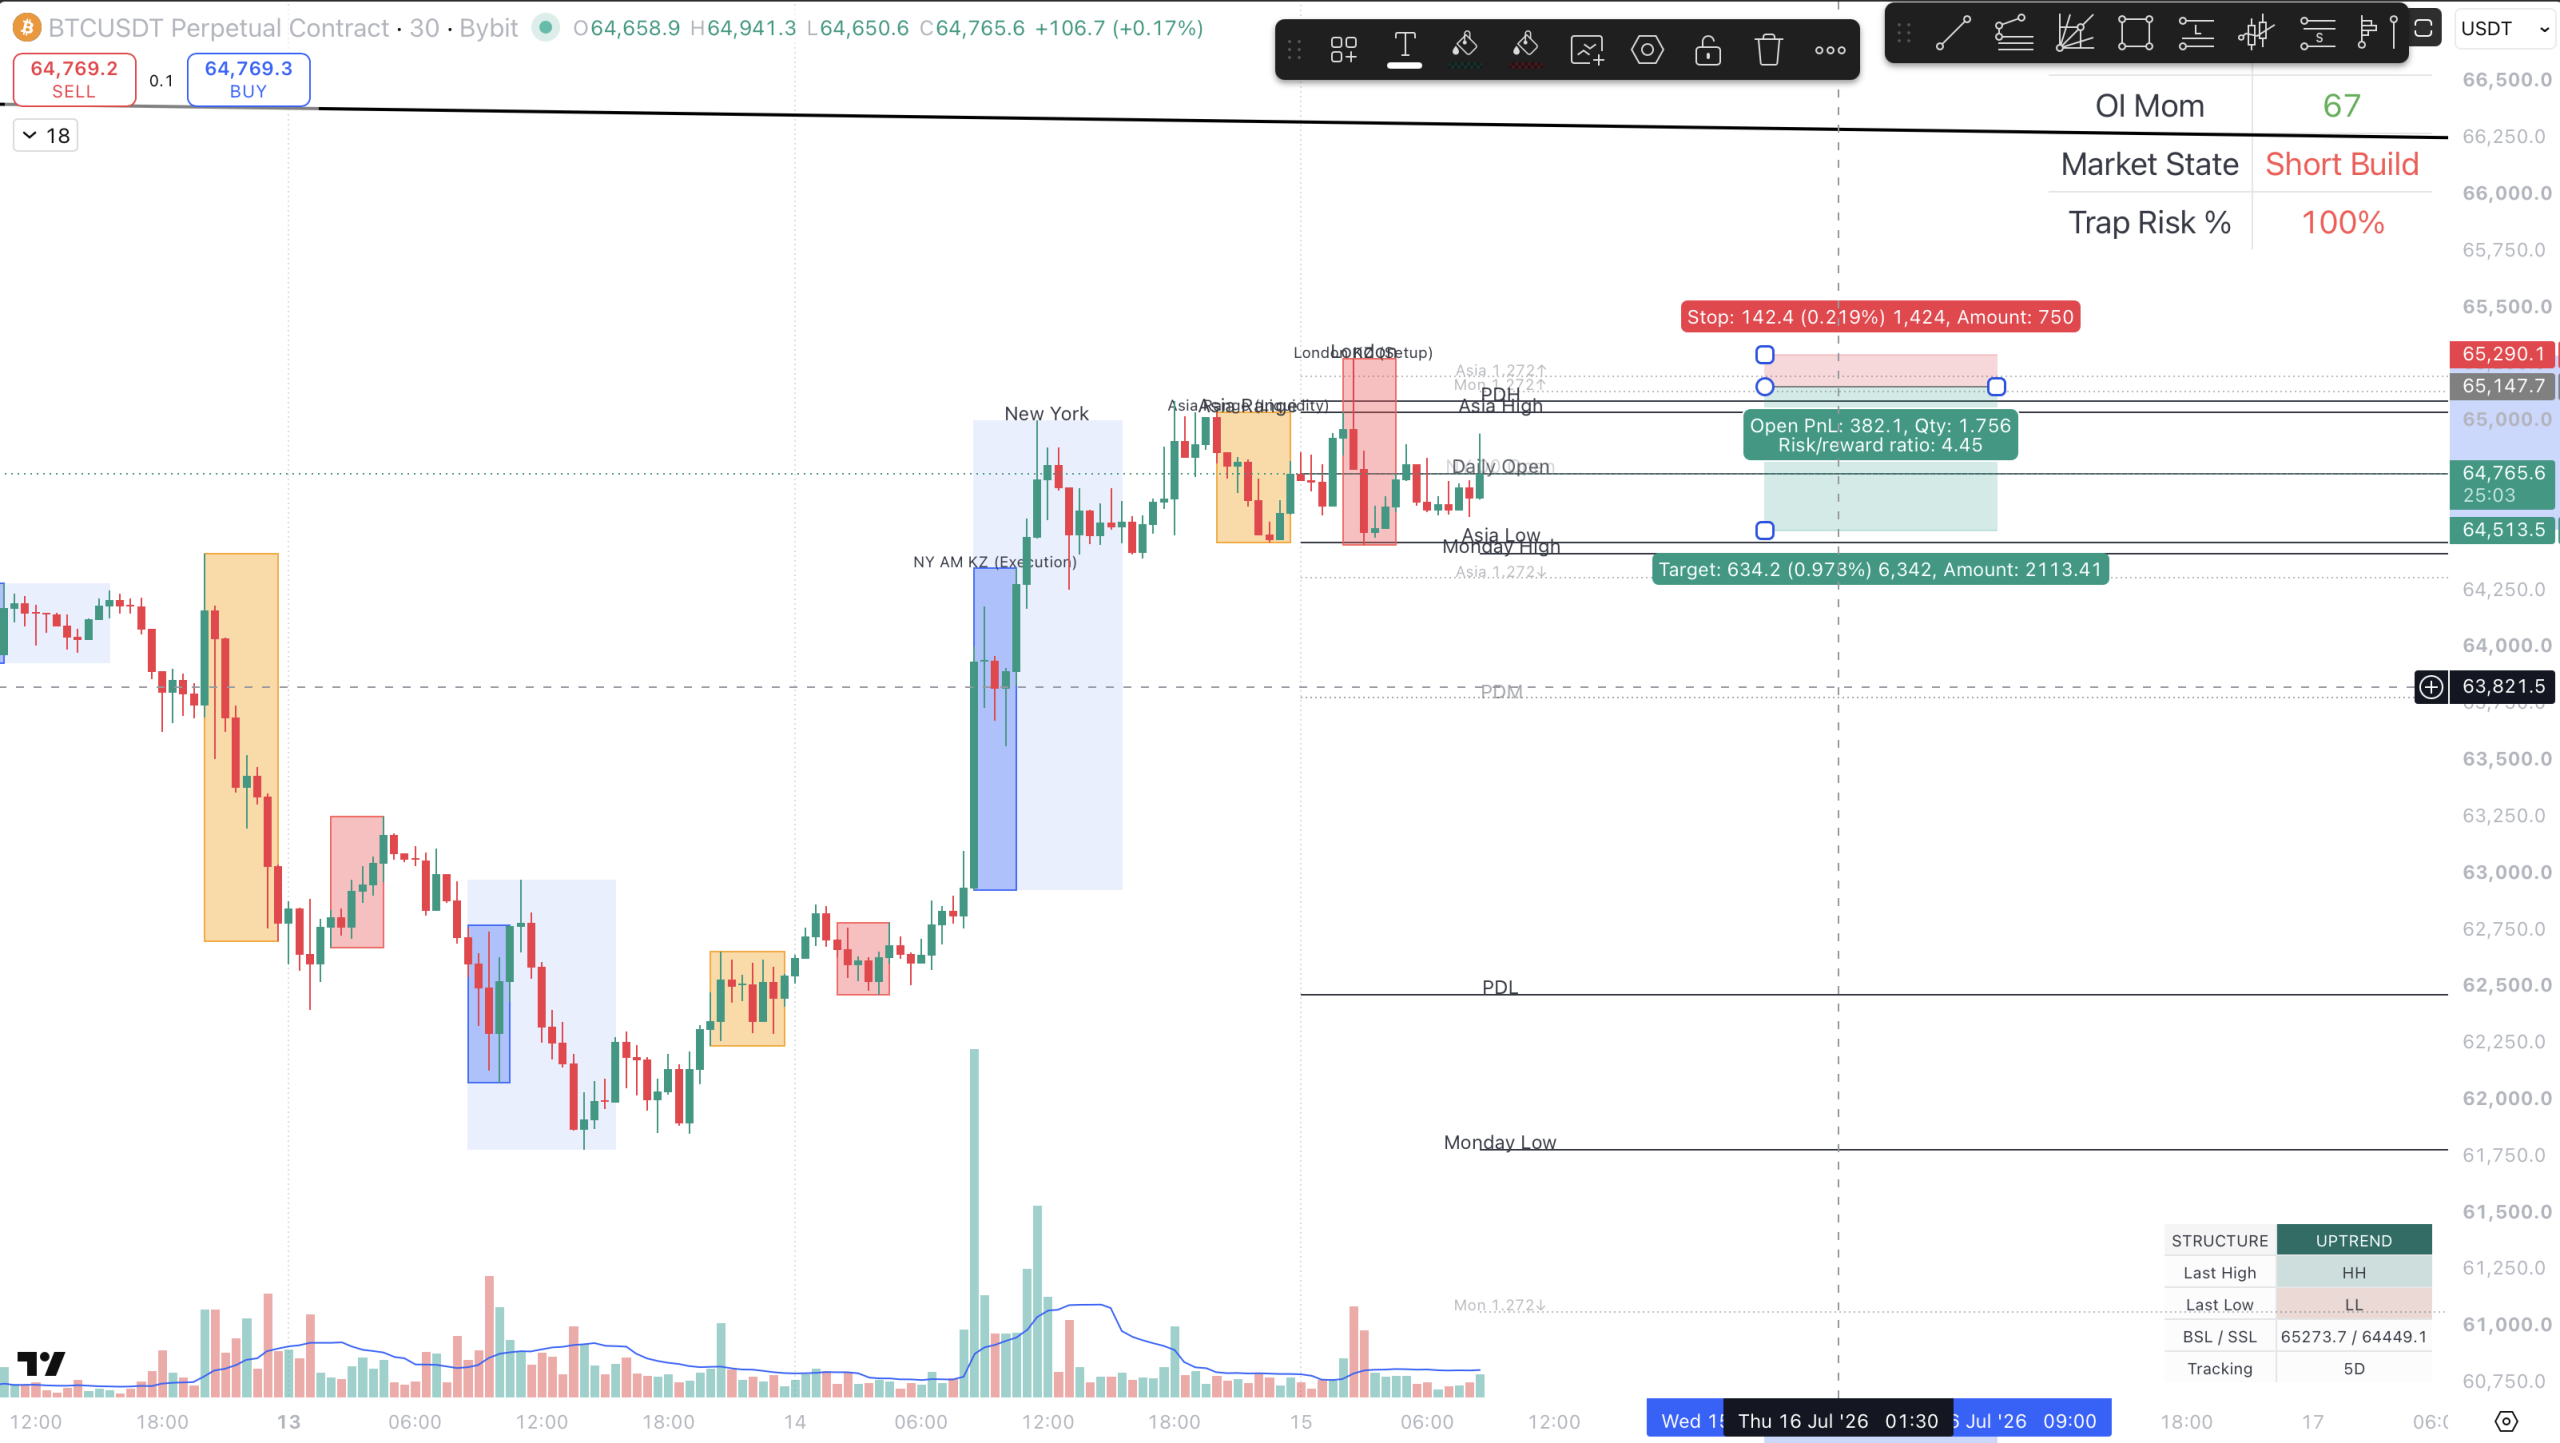
In this live briefing, we break down a classic ICT Turtle Soup execution that occurred during the transition from the Tuesday Asia session to the Wednesday London session on the BTC 30-minute chart.
The Target: Buy-Side Liquidity (BSL)
Markets move from one liquidity pool to another. During the Asia session, the price formed a tight consolidation, leaving the Asia High slightly above the previous New York range. To the untrained eye, this looked like the beginning of a sustained uptrend.
However, structurally, the Asia High and the Monday High resting just above it created a highly attractive pool of Buy-Side Liquidity (BSL)—a magnet for Smart Money.
The Execution: London Sweep and Absorption
The trap was sprung during the London session open.
- The Intent (The Sweep): The price aggressively pushed higher, piercing not only the 1.272 Fibonacci extension of the Asia High but also marginally sweeping the 1.272 level of the Monday High.
- The Confirmation (The Volume): This is where context matters. The breakout triggered retail buy stops, but the price failed to produce structural displacement. Instead, it left a wick. The breakout buyers were immediately absorbed by institutional limit sell orders.
- Execution (Turtle Soup): Once the failure to displace was confirmed, we executed a short scalp. This is the textbook ICT Turtle Soup model: fading the false breakout of a significant session high. Our invalidation (stop-loss) was strictly placed just above the London sweep high, targeting the internal session liquidity below.
The Bigger Picture: Institutional Volume Footprint
While the short scalp was a high-probability internal structure trade, we must respect the broader market narrative. If you look at the volume profile at the bottom of the chart, a critical divergence emerges.
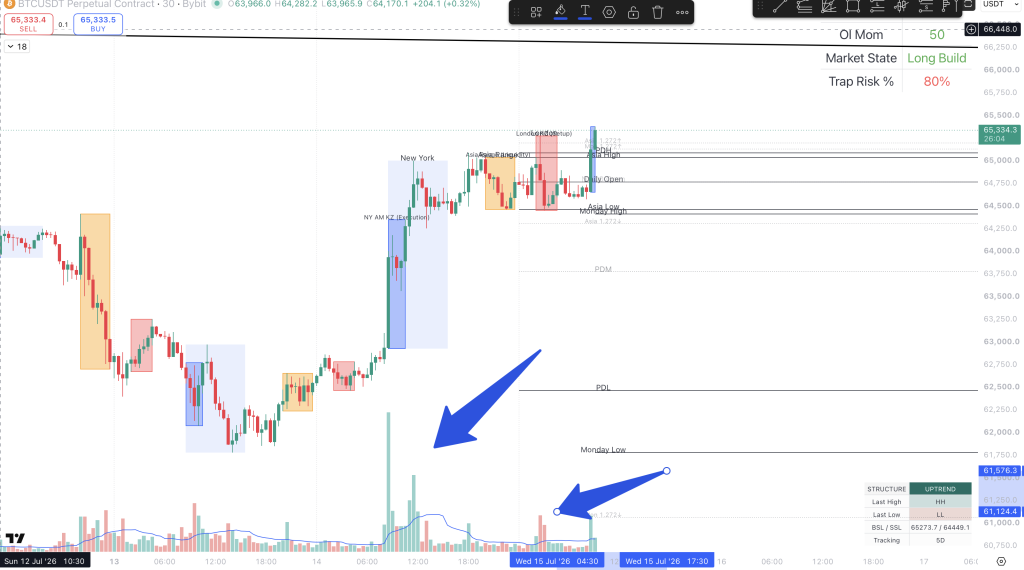
During the previous New York session, the market experienced massive, explosive buying volume (institutional displacement). However, during the recent London sweep that triggered our short scalp, the selling volume was relatively weak.
What does this tell us structurally?
The institutional capital that accumulated massive long positions during the NY session has not exited the market. There is no structural evidence of distribution or heavy offloading. Therefore, while we capitalized on the short-term liquidity grab, the overarching structural bias remains heavily tilted toward further upside. The Smart Money inventory is still holding.
Stop blindly trading the breakout. Read the volume, map the liquidity, and execute alongside the institutional order flow.
Leave a Reply