Bitcoin moved through a significant sequence during the Monday session.
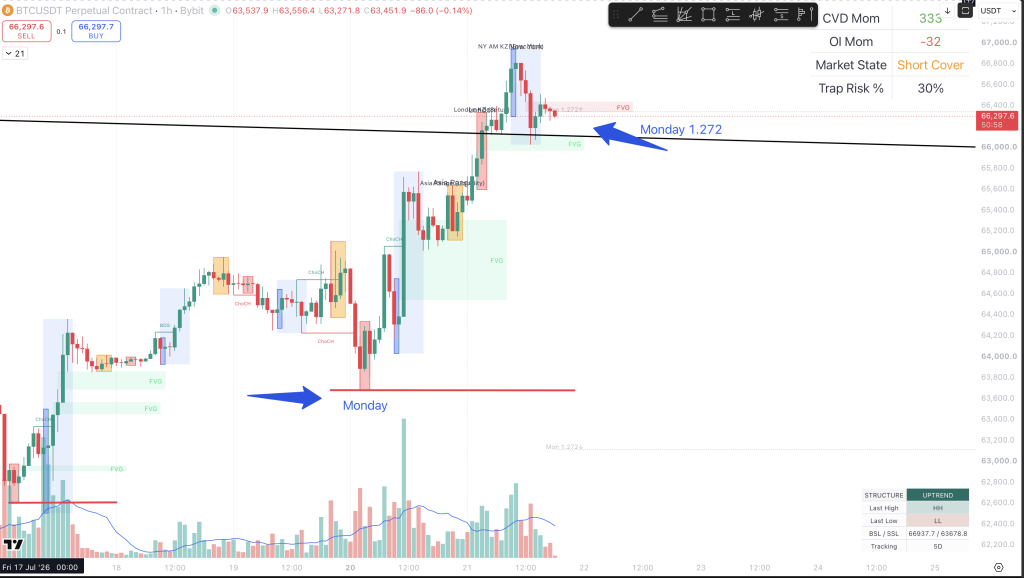
Price first traded below the Monday low, recovered, and then expanded through the upper side of the intraday structure. The advance subsequently reached the Monday 1.272 projection and the descending higher-timeframe boundary visible on the 1-hour and 8-hour charts.
That sequence confirms a successful bullish expansion from lower liquidity.
It does not yet confirm that price will continue directly higher.
The main structural question is now whether Bitcoin can maintain acceptance above the Monday expansion area or whether the move becomes a temporary liquidity event beneath higher-timeframe resistance.
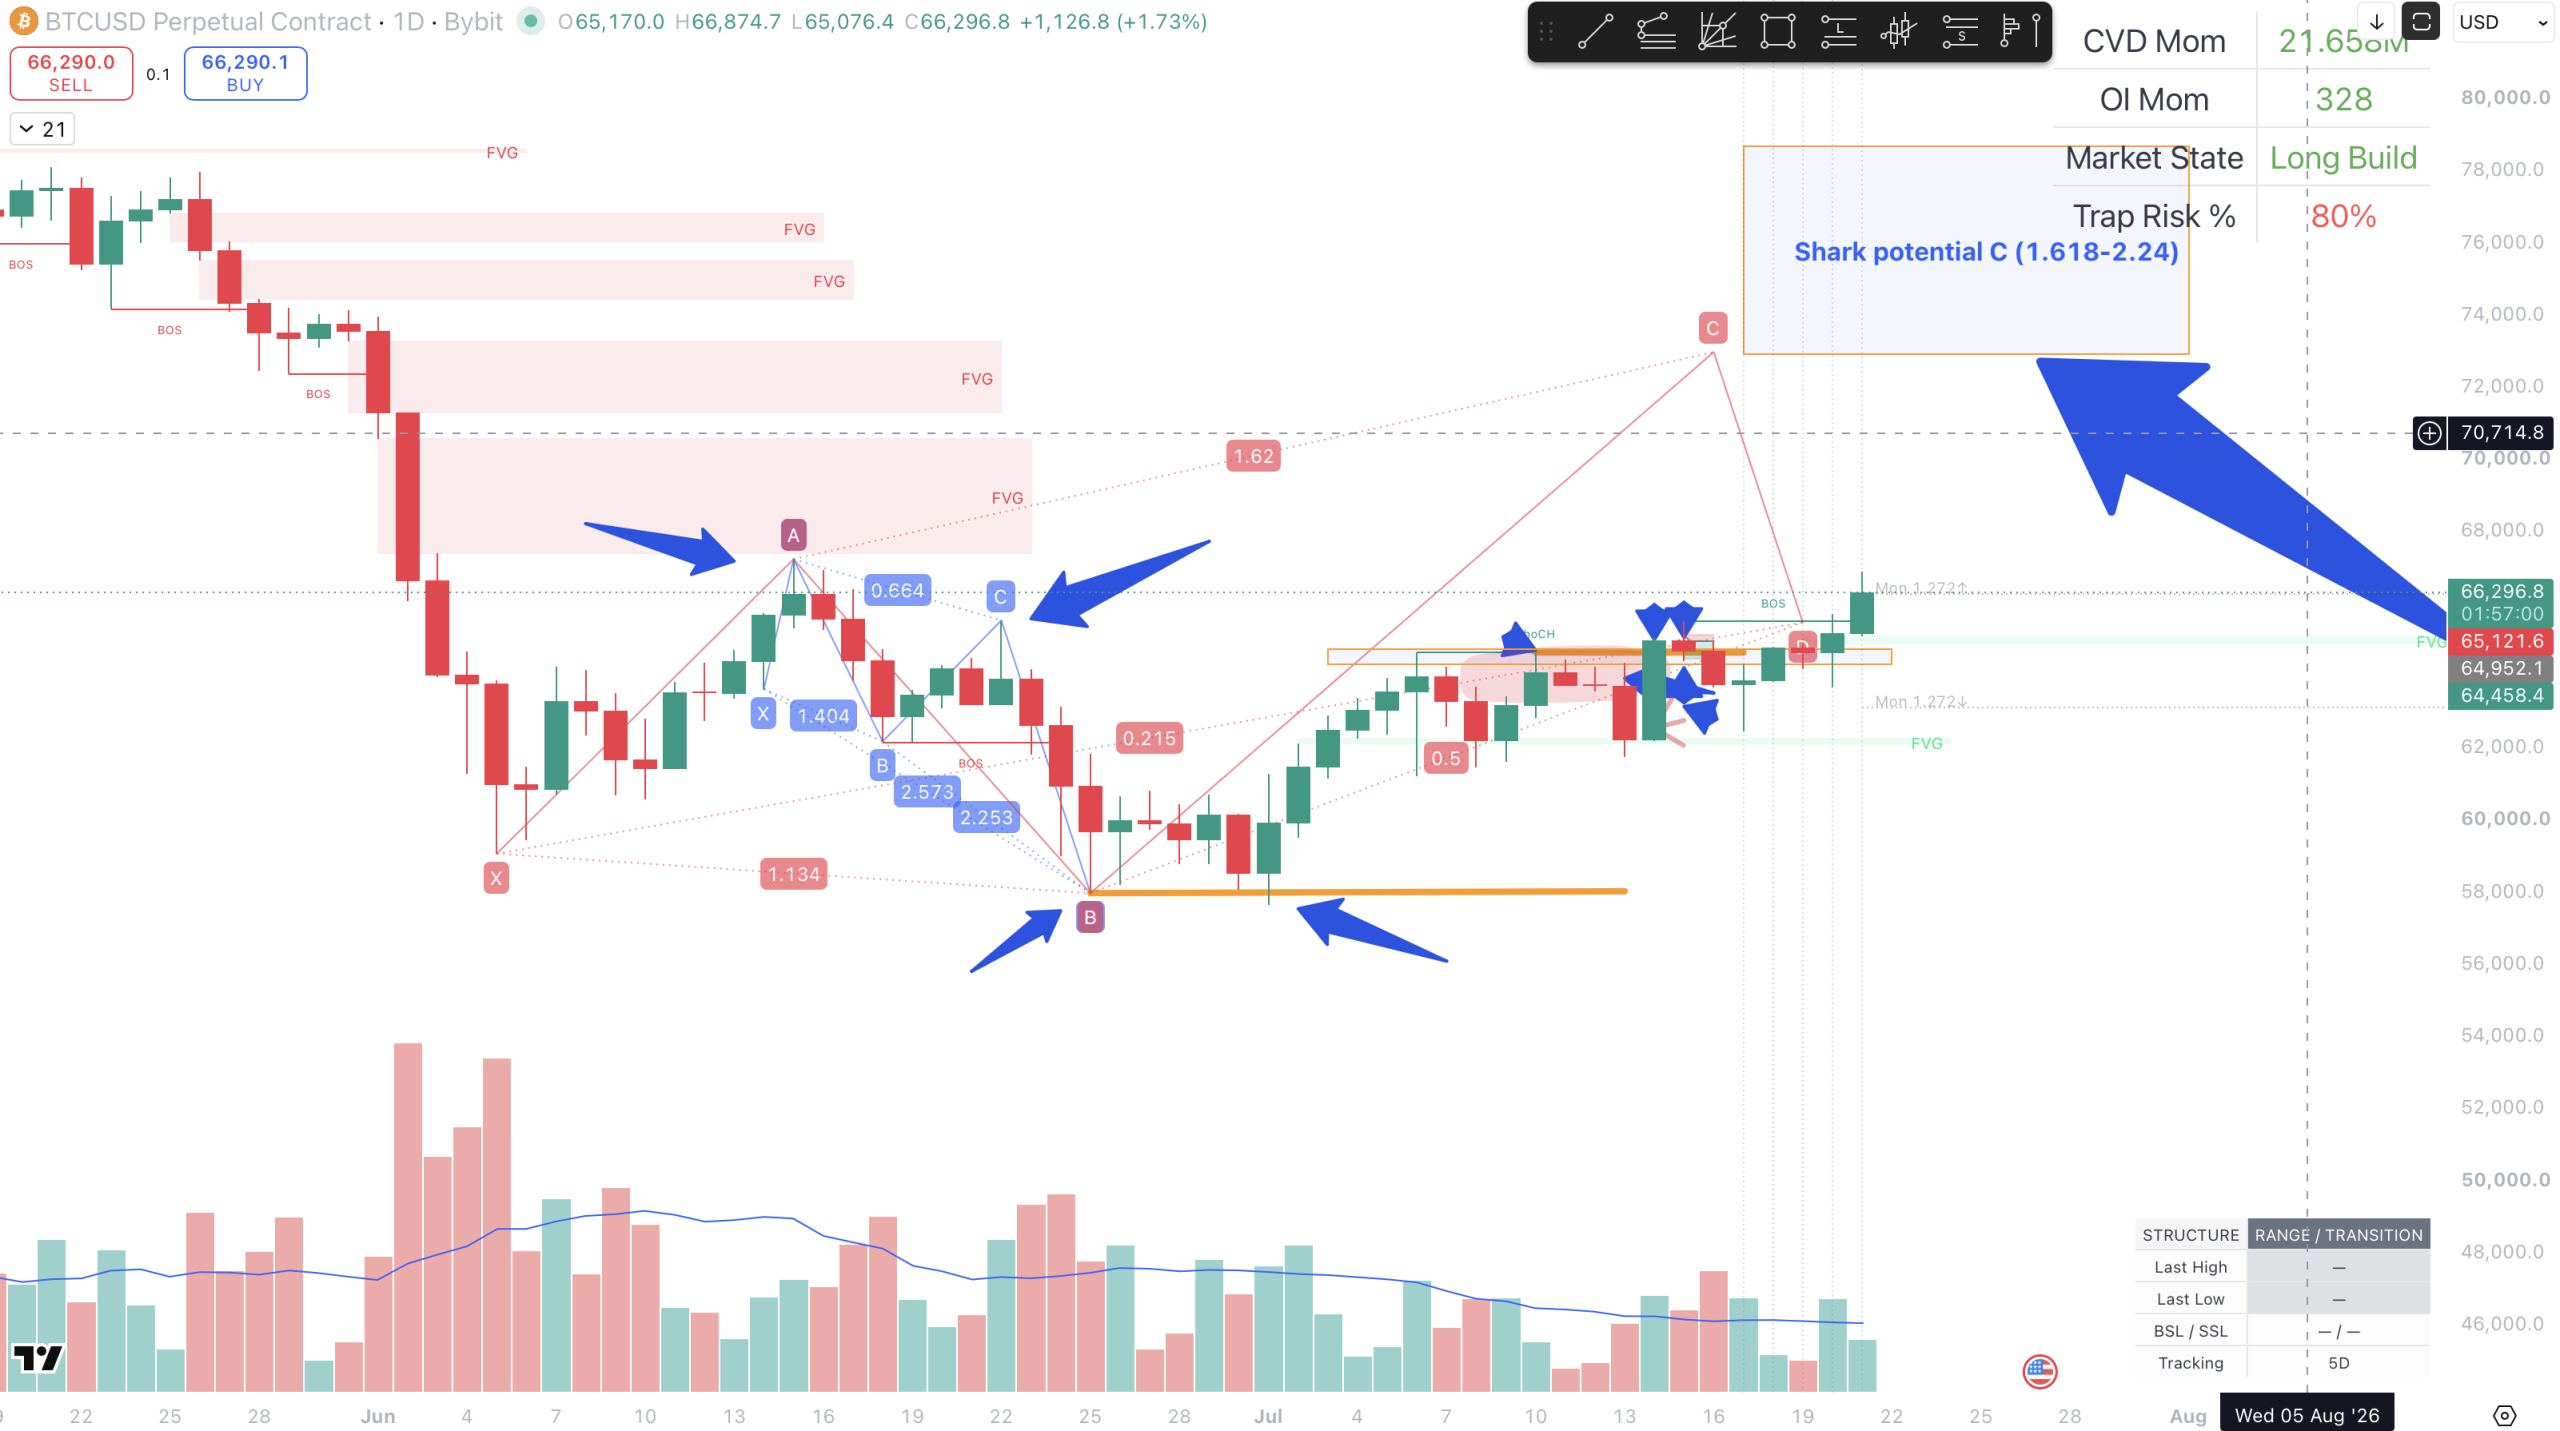
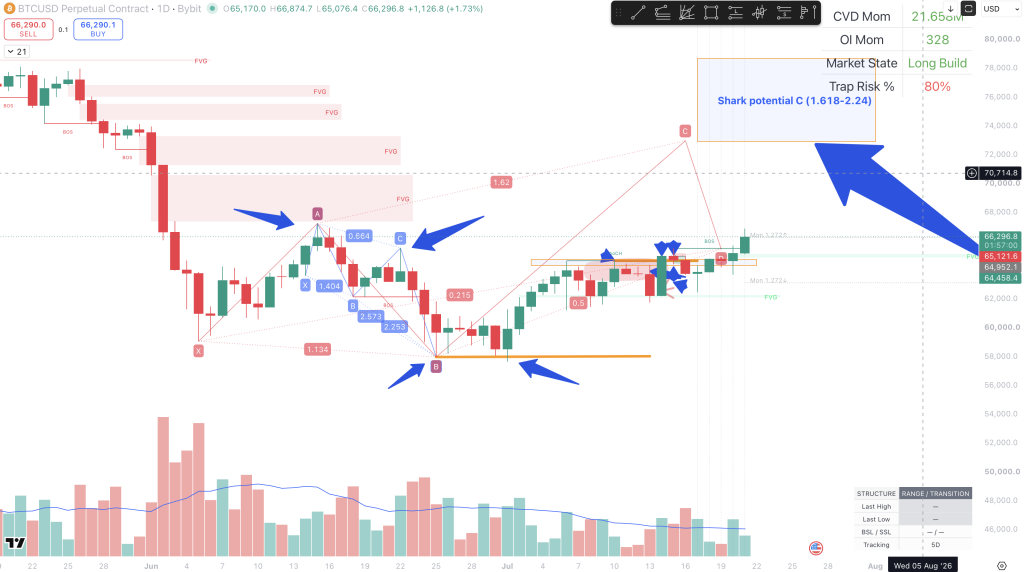
At the same time, the daily chart presents a possible developing Shark pattern. The harmonic structure may eventually open a higher target zone, but the pattern remains incomplete and should not be treated as a confirmed directional signal.
Structure must come before the harmonic projection.
Market Status
| Market Status | Assessment |
|---|---|
| Market | Bitcoin Perpetual Contract |
| Bias | Conditionally bullish |
| HTF Structure | Range-to-transition; testing the upper range boundary |
| Liquidity | Monday low swept; Monday upper projection traded |
| Institutional Intent | Demand is structurally visible, but participant identity is unconfirmed |
| Trade Status | Existing longs require active management; late entries carry extension risk |
| Invalidation | Acceptance below the controlling bullish impulse and failure to reclaim |
| Next Confirmation | Sustained acceptance above the 8H boundary or bearish displacement back into the range |
| Risk Level | Elevated near higher-timeframe resistance |
| Harmonic Status | Developing Shark candidate; incomplete |
1. Key Structural Problem
The market has already completed the easy part of the bullish thesis.
Bitcoin swept lower liquidity, recovered, displaced higher, and exceeded the Monday expansion level. Traders who entered near the lower-liquidity event had a clear structural advantage.
That advantage is no longer available at the same price.
Bitcoin is now testing a zone where several factors overlap:
- the Monday 1.272 projection;
- a descending higher-timeframe boundary;
- short-term upper liquidity;
- a nearby bearish fair value gap;
- the upper portion of the broader 8-hour range.
The decision is therefore no longer whether the Monday sweep produced a bullish reaction. That is already visible.
The decision is whether the expansion can produce acceptance outside the higher-timeframe range.
A breakout candle alone cannot answer that question. Bitcoin must either hold above the boundary and continue building structure, or fail and return into the prior range with bearish consequence.
This is the same distinction explained in the StructFirst guide to internal and external market structure. Internal bullish movement becomes more meaningful only when it changes the external structural condition.
2. HTF Structure
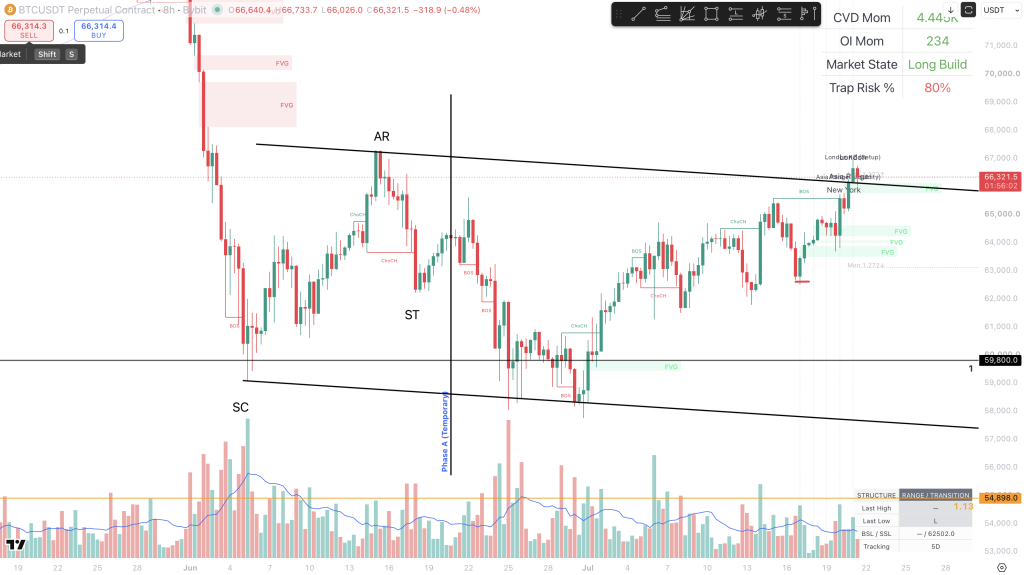
The daily chart remains best classified as a range or transition structure, not a fully confirmed trend continuation.
Price recovered strongly from the June low and has formed a sequence of higher short-term lows. However, the market is now approaching the upper side of the larger structure and several overhead imbalance zones.
The 8-hour chart shows this conflict more clearly.
Bitcoin advanced from the lower range boundary near the prior selling-climax area and returned toward the automatic-rally region. Price is now testing the descending line connecting the earlier range high with the present structure.
This produces two valid but competing observations.
Confirmed observation:
Bitcoin has recovered through multiple internal swing levels and created a sustained bullish advance.
Confirmed observation:
The broader external range has not yet been decisively cleared and accepted.
The 8-hour chart therefore remains transitional. Internal structure is bullish, while external structure still requires confirmation.
That is why the current move should not yet be presented as a completed higher-timeframe breakout.
3. Liquidity Positioning
The Monday low acted as the first important liquidity event.
Price traded through that low before producing a strong recovery. The subsequent advance then cleared intraday highs and moved through the Monday 1.272 projection.
This sequence matters because the lower sweep was followed by structural consequence.
A sweep by itself is not enough. The bullish interpretation became stronger only after price:
- reclaimed the swept level;
- produced directional expansion;
- created bullish imbalance;
- broke internal highs;
- continued toward external resistance.
The complete decision process is covered in What Is a Liquidity Sweep?, where the sweep is treated as an event requiring confirmation rather than as an automatic reversal signal.
The current liquidity problem is different.
The lower liquidity has already been used. Bitcoin is now trading near upper liquidity and higher-timeframe resistance. That reduces the quality of a late long entry because price is closer to the opposing objective than to the original bullish invalidation.
The market may still move higher, but the risk-to-structure relationship is no longer the same.
4. Wyckoff and ICT Context
The 8-hour structure can be interpreted through a Wyckoff range framework, but the labels must remain provisional.
The chart shows:
- a major decline into the lower range;
- a selling-climax area;
- an automatic rally;
- a secondary test;
- another move toward the lower boundary;
- a sustained recovery back toward the upper range.
This is consistent with a recovery through a broad trading range.
It does not prove that the entire structure is accumulation.
A complete accumulation thesis would require stronger evidence that supply has been absorbed and that price can establish acceptance above the upper range boundary. Until that happens, the same range can still produce rejection or continued rotation.
From an ICT perspective, the Monday low sweep was followed by bullish displacement and several fair value gaps.
Those imbalances show that the advance moved with reduced overlap. They may provide reaction zones during a pullback, but they do not guarantee support.
An FVG matters only when:
- the controlling bullish structure remains valid;
- price reacts constructively within or above it;
- bearish displacement does not invalidate the impulse;
- the market can continue toward external liquidity.
A deeper explanation of this distinction is available in What Is Displacement in Trading?. Strong candles matter because of the structure they change, not because of their size alone.
5. Institutional Intent
The chart supports a structural inference that meaningful demand entered after the Monday low was traded.
This inference is based on the reaction:
- price recovered rapidly;
- directional candles expanded;
- multiple internal highs were cleared;
- bullish imbalances remained beneath price;
- the market reached the upper range boundary.
However, the chart does not confirm who initiated that buying.
It would therefore be inappropriate to claim that institutions deliberately swept the Monday low or intentionally trapped retail traders.
What can be stated is narrower and more accurate:
The Monday sell-side liquidity event was followed by sustained bullish displacement and a meaningful change in internal structure.
Intent should be inferred from price behavior, not assigned to an unidentified market participant.
6. Confirmation
The bullish thesis has received meaningful confirmation, but continuation outside the higher-timeframe range remains unconfirmed.
Confirmed observations
- The Monday low was traded.
- Price recovered above the swept level.
- Bullish displacement followed.
- Multiple internal swing highs were broken.
- The Monday 1.272 projection was reached.
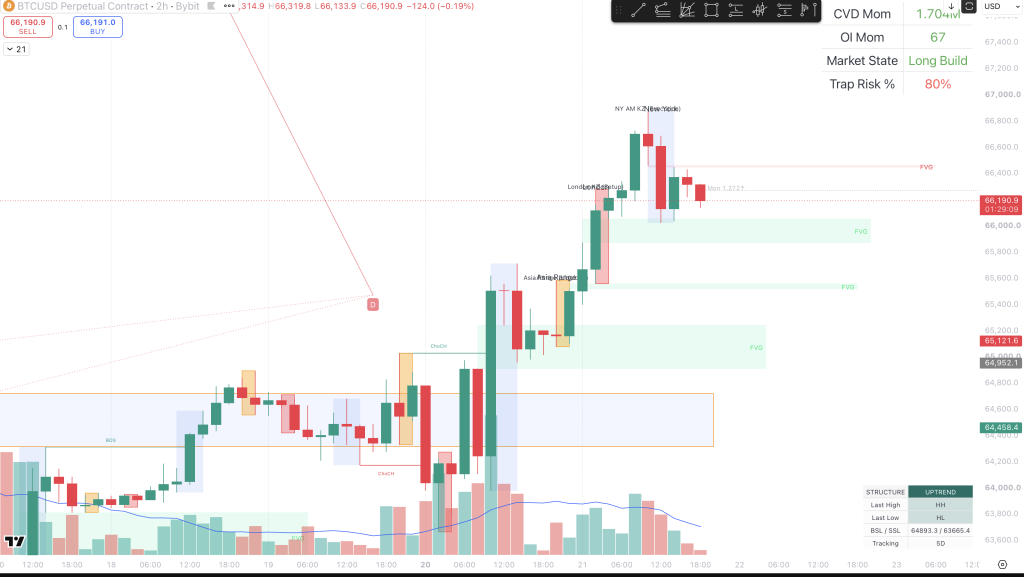
- The 1-hour and 2-hour charts show higher-high and higher-low conditions.
- Price is testing the descending external boundary.
Not yet confirmed
- Sustained acceptance above the 8-hour upper boundary.
- A completed higher-timeframe breakout.
- Completion of the proposed Shark pattern.
- Continuation toward the daily harmonic target zone.
- A confirmed bearish reversal from the current resistance.
The present structure therefore supports a conditional bullish bias, not an unconditional continuation call.
A small lower-timeframe CHoCH would also be insufficient by itself to reverse that bias. As explained in BOS vs CHoCH vs Market Structure Shift, an internal shift must be evaluated against the larger liquidity and external structure.
7. Invalidation
Invalidation must be defined before additional targets are considered.
The bullish thesis would not be invalidated by a single red candle or a brief wick below a fair value gap.
The more meaningful failure sequence would be:
- Bitcoin rejects the upper boundary with bearish displacement.
- Price breaks the controlling higher low of the bullish impulse.
- The market fails to reclaim the broken structure.
- Price begins accepting back inside the prior 8-hour range.
- The bullish FVG sequence stops producing constructive reactions.
That sequence would indicate that the move above the Monday projection failed to establish acceptance.
The exact execution-level invalidation depends on the trader’s timeframe.
A 15-minute trader may use a lower-timeframe impulse origin. A 2-hour or 8-hour thesis requires a wider structural invalidation. These cannot be treated as interchangeable.
8. Execution Condition
The highest-quality long opportunity occurred closer to the Monday sell-side sweep and the initial bullish recovery.
The current market is less attractive for a new entry because:
- price has already traveled through multiple targets;
- the external boundary is nearby;
- the logical invalidation is farther away;
- upper liquidity has already been engaged;
- the market may require consolidation before continuation.
For an existing long position, execution now becomes trade management.
A professional response may include:
- taking partial profit near upper liquidity;
- reducing position size after the expansion;
- moving the stop toward breakeven when structurally appropriate;
- retaining a smaller runner while the impulse remains valid;
- avoiding additional exposure directly beneath resistance.
Breakeven management reduces initial directional risk, but it does not remove slippage, fees, or execution risk.
For a new long, the preferred conditions would be either:
- a controlled pullback into a bullish FVG followed by lower-timeframe confirmation; or
- clear acceptance above the 8-hour boundary followed by a successful retest.
For a short, rejection alone is insufficient. The market would first need bearish displacement and a failed reclaim.
9. Harmonic and PRZ Check
The daily chart presents a possible developing Shark pattern following the prior harmonic sequence.
The proposed upper C zone is marked between the 1.618 and 2.24 projections, approximately within the broad area shown on the chart above current price.
This is a user thesis supported by a preliminary harmonic drawing.
It is not yet a completed pattern.
For the Shark thesis to remain valid, the following must be verified:
- the X, A, B, and developing C points are correctly anchored;
- the relevant harmonic ratios remain within acceptable ranges;
- price reaches the projected completion zone;
- the pattern is not invalidated before completion;
- the eventual PRZ produces an observable reaction;
- structure confirms either acceptance or rejection.
The projected zone should not be treated as a guaranteed target.
It is a potential completion area only.
Even if Bitcoin reaches that zone, the PRZ would require confirmation. A harmonic ratio does not automatically create a reversal.
A later 5-0 pattern may develop after a completed Shark, but that sequence remains even further removed from confirmation. It should be treated as an unconfirmed future possibility rather than as part of the present execution thesis.
10. MDA D1–D10 Verification
The current chart provides partial support for a bullish market-delivery sequence, but the full MDA sequence cannot be verified from these screenshots alone.
D1 — Higher-Timeframe Context
Confirmed.
Bitcoin is trading inside a larger range or transition structure and testing its upper boundary.
D2 — Liquidity Event
Confirmed.
The Monday low was traded before the bullish expansion.
D3 — Reclaim
Confirmed.
Price recovered above the swept Monday level.
D4 — Displacement
Confirmed.
The advance produced strong directional movement and multiple bullish imbalances.
D5 — Structural Break
Confirmed internally.
Multiple short-term highs were broken.
D6 — External Structure Change
Not fully confirmed.
Bitcoin is testing the upper 8-hour boundary, but acceptance beyond it remains incomplete.
D7 — Imbalance Support
Partially confirmed.
Several bullish FVGs remain below price, but their future support function has not yet been tested completely.
D8 — Continuation
Unconfirmed.
The market has not yet established sustained expansion beyond the higher-timeframe boundary.
D9 — Failure Logic
Defined.
Bearish displacement, loss of the controlling higher low, and failed reclaim would weaken the bullish thesis.
D10 — Execution Quality
Reduced at the current location.
The market is extended relative to the original Monday liquidity event and is testing resistance.
11. Primary Scenario
The primary scenario is a controlled consolidation or pullback followed by acceptance above the external range boundary.
This scenario remains valid while:
- the bullish impulse structure is protected;
- price continues forming higher lows;
- bullish FVGs produce constructive reactions;
- no meaningful bearish displacement appears;
- the external boundary is eventually reclaimed and held.
Under this scenario, Bitcoin may continue toward unresolved daily imbalance and higher external liquidity.
The daily Shark projection could become more relevant if the market continues expanding, but it should remain secondary to observable structure.
The harmonic target must follow the breakout confirmation. It cannot substitute for it.
12. Secondary Scenario
The secondary scenario is a failed breakout and return into the 8-hour range.
This becomes more likely if Bitcoin:
- trades above the current resistance again;
- fails to hold the breakout;
- produces bearish displacement;
- breaks the nearest meaningful higher low;
- fails to reclaim the external boundary;
- accepts beneath the Monday 1.272 region.
In that case, the current advance may be reclassified as an upper-liquidity event rather than as confirmed continuation.
The first downside objectives would then be the bullish imbalances and internal liquidity beneath the current price.
A move back to the Monday low should not be assumed immediately. Each lower liquidity zone would need to be evaluated as price approaches it.
13. Target Liquidity
Bullish liquidity objectives
The chart shows several areas of interest above the current market:
- the recent New York session high;
- higher external buy-side liquidity;
- the daily imbalance zones;
- the marked level near 70,714;
- the broader proposed Shark C projection zone.
These are liquidity and structural objectives, not guaranteed price targets.
Bearish liquidity objectives
If failure is confirmed, downside areas include:
- the nearest 2-hour bullish FVG;
- the lower stacked imbalance zones;
- the prior breakout structure;
- internal sell-side liquidity beneath the recent higher lows;
- the Monday range structure.
Targets should only become actionable after confirmation of the relevant scenario.
14. Risk Assessment
The principal risk is not that the bullish structure is immediately invalid.
The principal risk is that traders enter late after the move has already traveled from lower liquidity into external resistance.
Current risks include:
- chasing a bullish expansion beneath resistance;
- assuming the 8-hour breakout is confirmed before acceptance;
- treating stacked FVGs as guaranteed support;
- forcing a full Wyckoff accumulation label;
- treating the Shark projection as a confirmed target;
- assuming a rejection candle confirms reversal;
- using a lower-timeframe invalidation for a higher-timeframe thesis;
- retaining full position size after a major liquidity objective has been reached.
The 2-hour chart also displays a high trap-risk reading. That indicator should not be treated as an independent trading signal, but it supports the need for caution near the upper boundary.
15. No-Trade Conditions
No new position is justified when:
- Bitcoin remains trapped between the external boundary and the nearest bullish FVG;
- neither breakout acceptance nor bearish displacement is present;
- the required stop is too wide relative to the next liquidity objective;
- the trade depends only on the developing Shark projection;
- price is extended from the original Monday sweep;
- a short thesis relies only on a rejection wick;
- a long thesis assumes the range boundary must break;
- the trader cannot define structural invalidation before entry.
No-trade is a valid professional decision in the present location.
The chart already delivered a meaningful expansion. Missing the initial entry does not justify accepting inferior risk near the next structural decision point.
Expand Your Structural Edge
Bitcoin’s move from the Monday low was structurally meaningful because the liquidity sweep was followed by reclaim, displacement, imbalance, and internal structural breaks.
That bullish sequence is confirmed.
What remains unconfirmed is the next layer of the thesis.
Bitcoin has not yet established clear acceptance outside the 8-hour range, and the proposed daily Shark pattern remains incomplete. The market may continue higher, but the harmonic projection should not be allowed to override current structure.
For existing long positions, the main task is risk management.
For new positions, the next actionable opportunity should come from one of two conditions:
- confirmed acceptance above the external boundary; or
- confirmed failure through bearish displacement and a failed reclaim.
Until one of those conditions appears, the market is better treated as a decision zone than as a directional certainty.
Track the live order flow and volume footprint yourself directly on TradingView.
Related StructFirst Reading
The Monday low event is best understood through the complete process explained in What Is a Liquidity Sweep?.
The bullish advance should be evaluated through What Is Displacement in Trading?, where strong candles are separated from genuine structural consequence.
The difference between the bullish internal sequence and the unresolved 8-hour boundary is explained in Internal vs External Market Structure.
A lower-timeframe bearish shift should not be treated as a completed reversal without the conditions outlined in BOS vs CHoCH vs Market Structure Shift.
For the earlier harmonic context, see Bitcoin Bullish Butterfly: When Harmonics Meet Liquidity Traps.
Leave a Reply