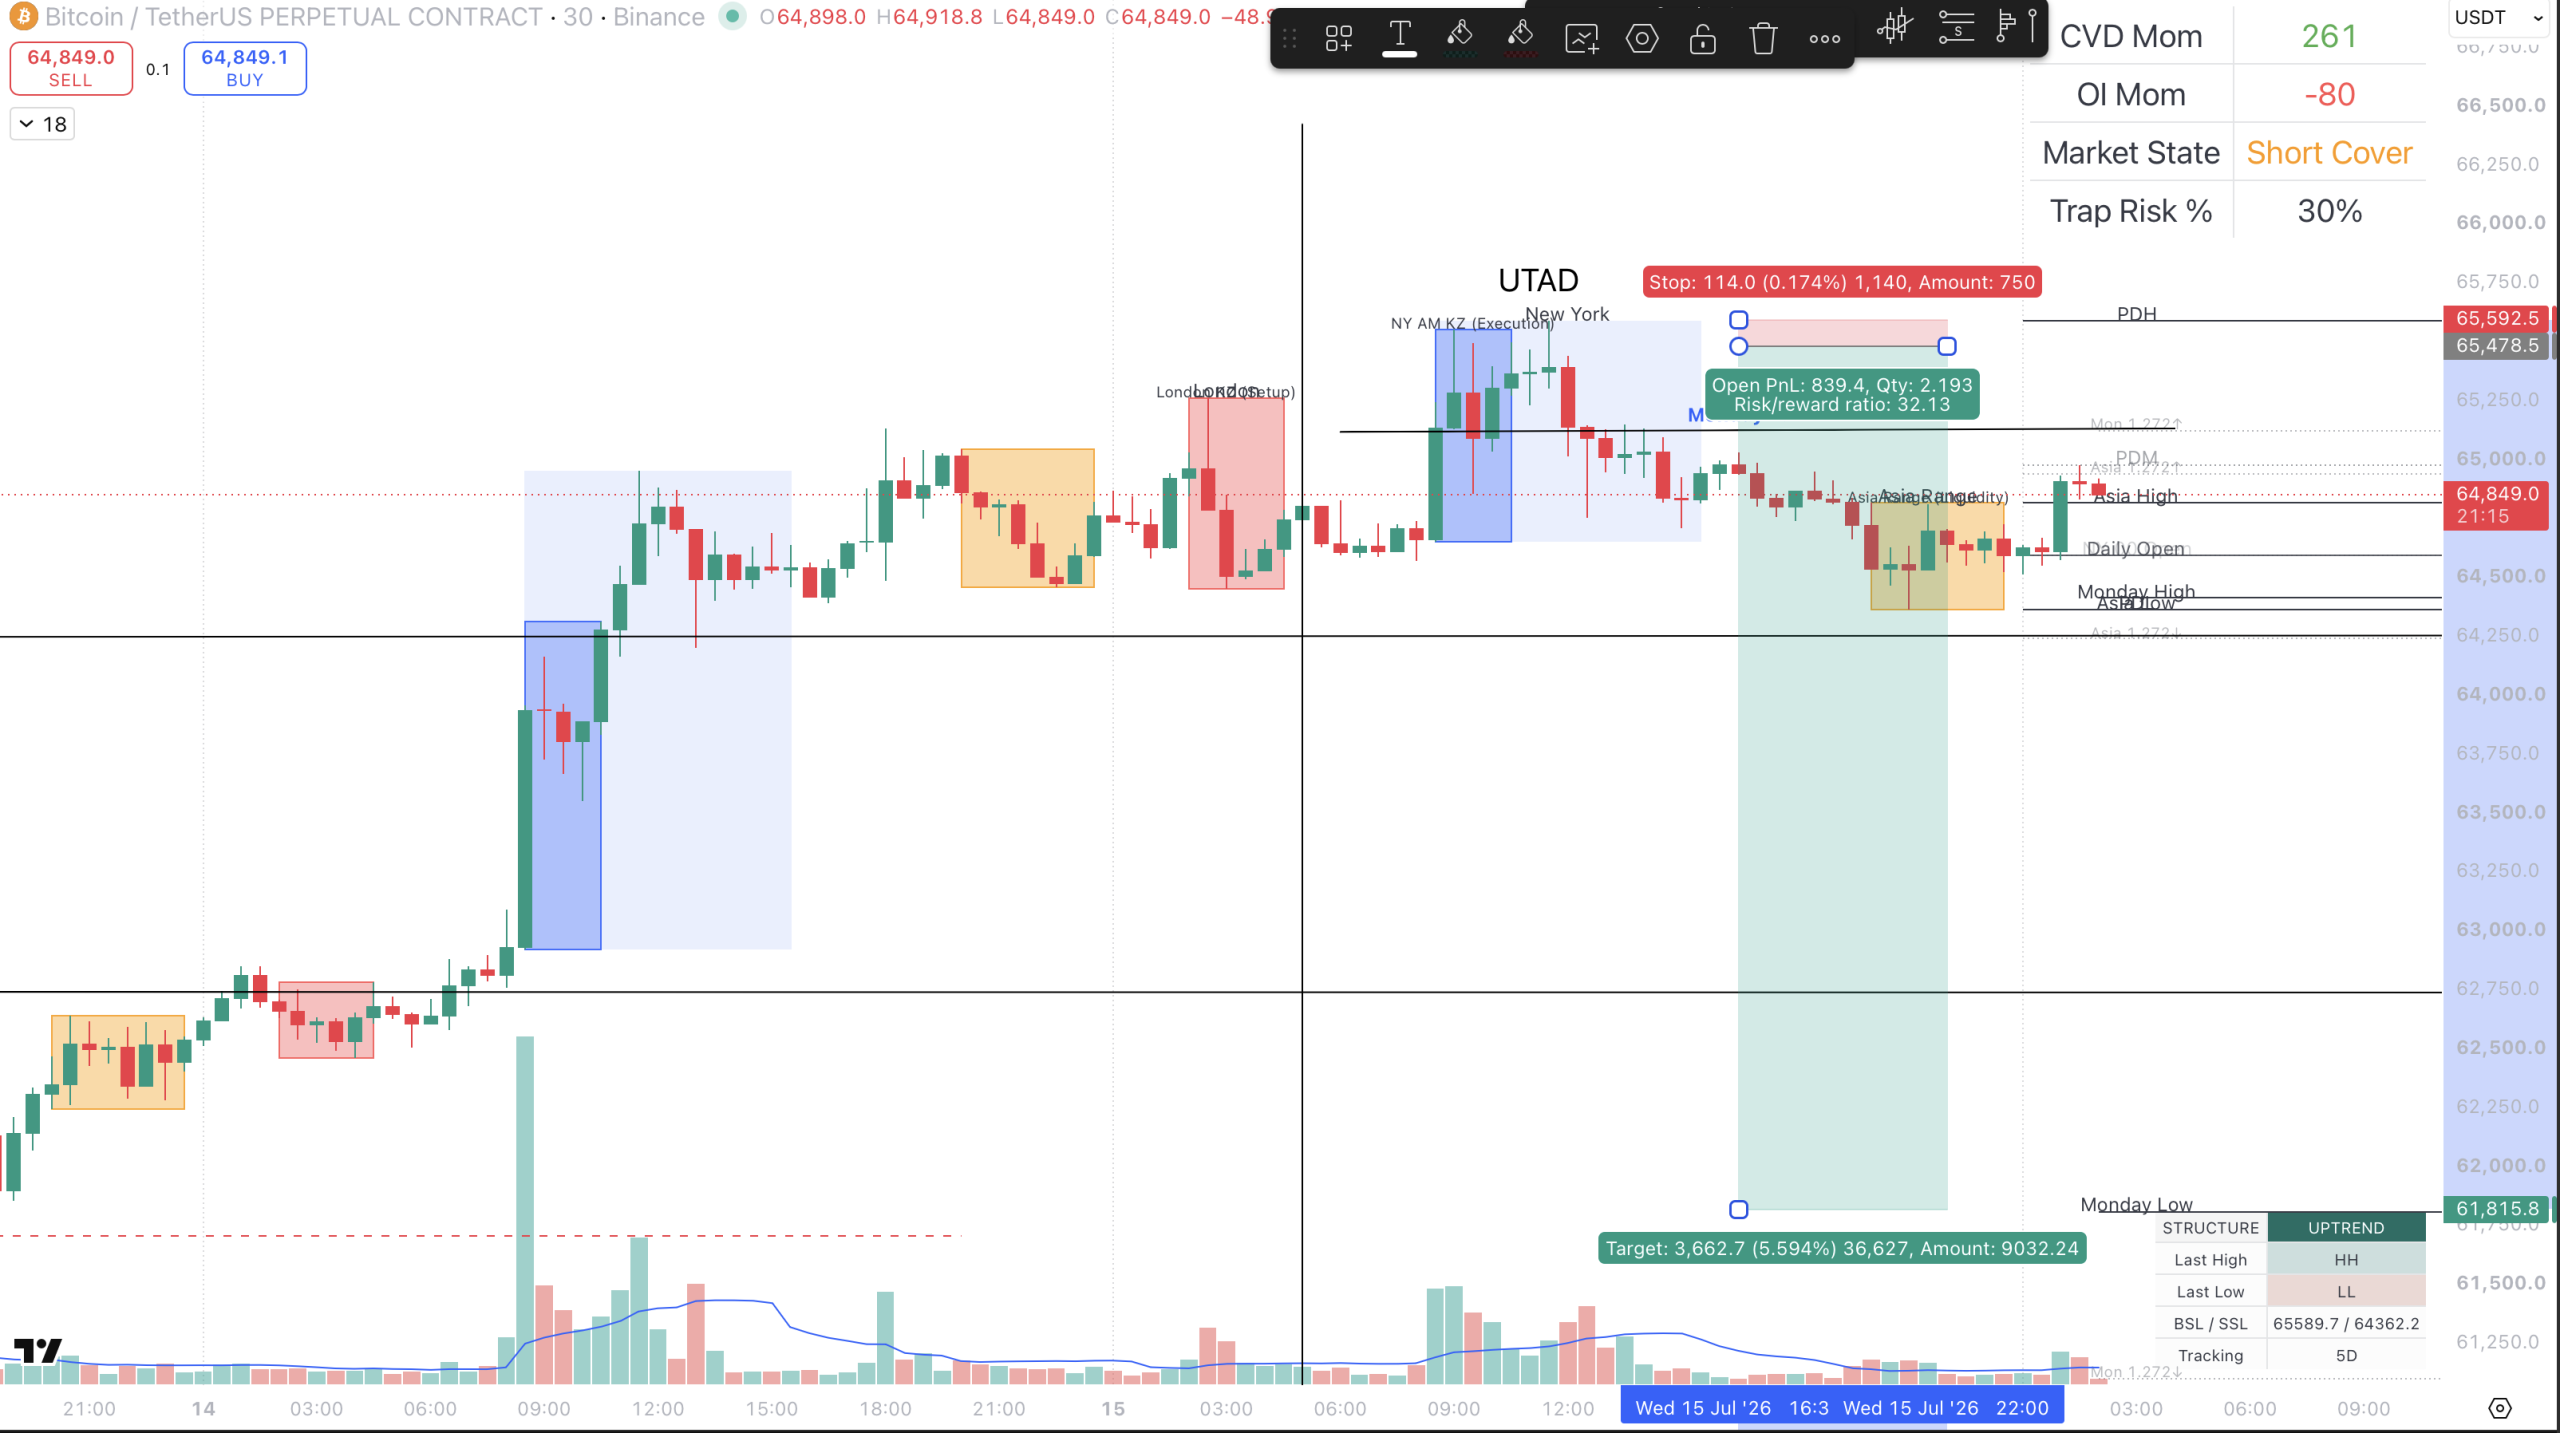
Falling for a Wyckoff UTAD trap is one of the most common reasons retail traders lose their capital during a market distribution phase. Many retail traders blindly buy the breakout when the price makes a new local high. They see a strong green candle piercing structural resistance and immediately assume a massive bullish continuation is underway.
However, structural operators and Smart Money algorithms view these new highs completely differently. They know these levels are artificially engineered to hunt buy-side liquidity (BSL). The institutions need this retail buying pressure to absorb their massive sell orders before initiating a severe reversal.
In today’s live briefing, we break down a textbook short execution on the Bitcoin (BTC) futures market. We will walk through exactly how we identified a Wyckoff UTAD trap and combined it with an ICT New York Killzone setup to secure a high-probability, risk-free short position.
1. The Macro View: Identifying the Wyckoff UTAD Trap
Before dropping down to execution timeframes, we must establish the higher timeframe (HTF) context. The Bitcoin 1H chart has been printing a classic Wyckoff Distribution schematic.
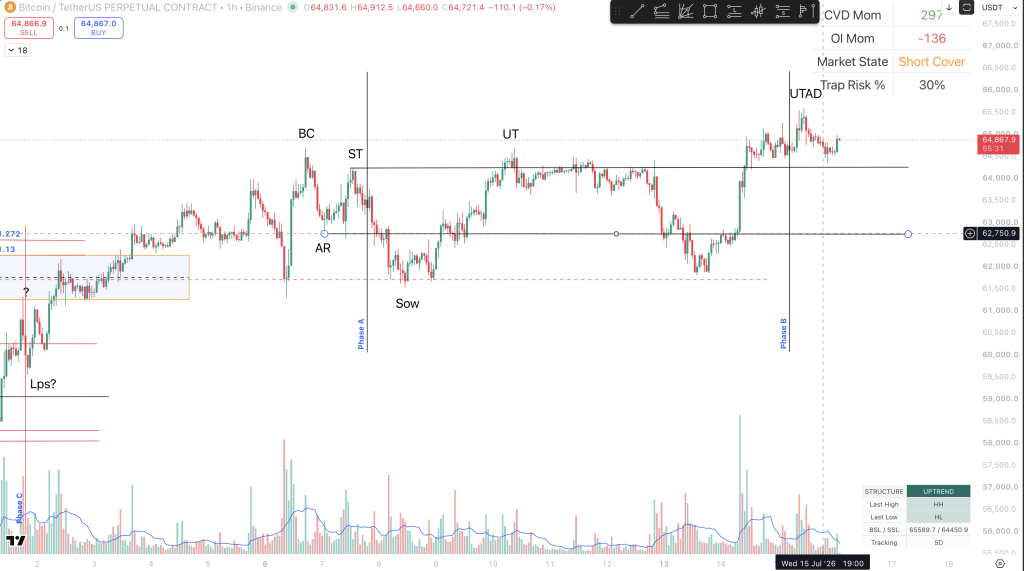
We identified the initial Buying Climax (BC) and the Automatic Reaction (AR), establishing our primary trading range. Recently, the price pushed above the previous Upthrust (UT) level.
For a textbook trader, this looks like a bullish continuation. However, structurally, this raised an immediate red flag. We suspected this was Phase C of the distribution cycle—a classic Wyckoff UTAD trap (Upthrust After Distribution) designed to sweep the final pockets of liquidity before a heavy markdown.
2. The Micro Execution: The NY Killzone Trigger
We do not short simply because we suspect a Wyckoff UTAD trap. We wait for structural confirmation. We zoomed into the 30M chart to observe the price action during a high-volatility window: the ICT New York Session Killzone.
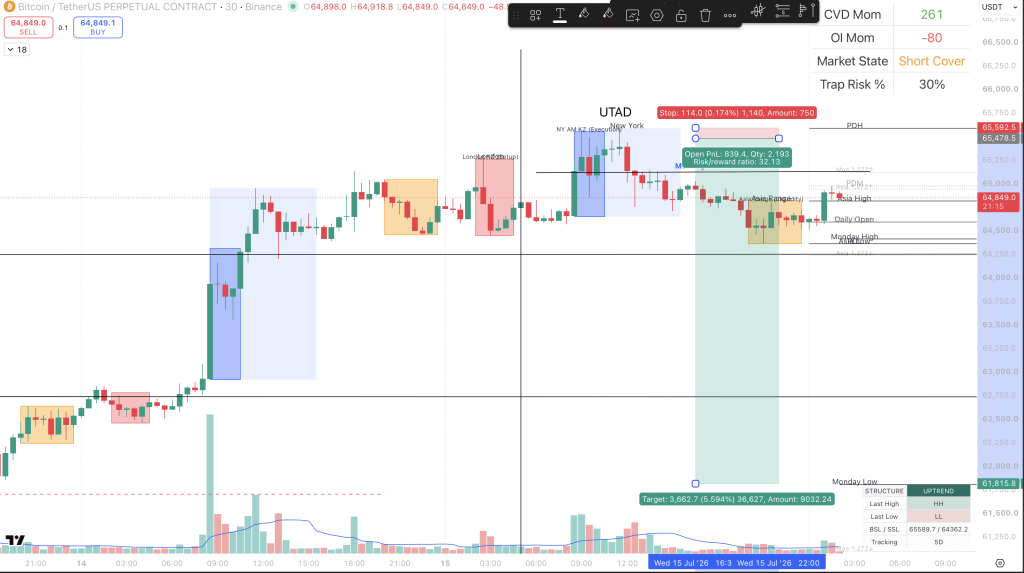
Here is the precise execution logic:
- The Liquidity Sweep: Price aggressively pierced the 1.272 Fibonacci extension of Monday’s High. This is a massive institutional liquidity pool where retail breakout traders place their buy stops.
- The Candlestick Footprint: Right at this critical 1.272 level, inside the NY Killzone, the market printed a Doji candle. This indicated a sudden halt in buying momentum and aggressive absorption by sellers.
- The Confirmation (Displacement): The very next candle was a strong bearish body accompanied by a spike in selling volume. The trap was confirmed. The Smart Money had stepped in. We executed our short position.
3. The Importance of Session Timing and Volume
Why did we execute specifically during the New York Killzone? A structural sweep like the 1.272 extension requires extreme institutional participation to be valid. The NY session provides the highest concentration of algorithmic order flow.
If a Wyckoff UTAD trap is going to unfold, it will happen when the most liquidity is available. The Doji candle we observed would have been less reliable during the low-volume Asian session. But printing that specific footprint exactly at the liquidity pool during the NY open provided the ultimate confirmation that Smart Money was accumulating short inventory.
4. Trade Management: The Risk-Free Position
Professional trading is about risk management, not just entries. Once inside the trade, we established strict liquidity-based targets:
- Target 1 (TP1) – Previous Daily Low (PDL): This was our primary structural target. Price aggressively moved down and swept the PDL, filling our TP1.
- Risk-Free Adjustment: Upon taking partial profits at TP1, we immediately moved our Stop Loss to our exact entry price. This trade is now mathematically risk-free.
- Target 2 (TP2) – Monday’s Low: We are letting the remaining position run, targeting the massive sell-side liquidity (SSL) resting below Monday’s Low.
- Invalidation: If the price reverses and tags our entry price, the position will be closed at breakeven. We do not hope; we follow the structure.
Expand Your Structural Edge
Understanding how institutions use false breakouts to build their inventory is the key to surviving the crypto markets. Do not become exit liquidity for the Smart Money.
Read our deep-dive on institutional traps:become exit liquidity for the Smart Money.
Read our deep-dive on institutional traps:
🔗 SpaceX 2H: Wyckoff Distribution Trap & Low-Volume Breakdown
Leave a Reply