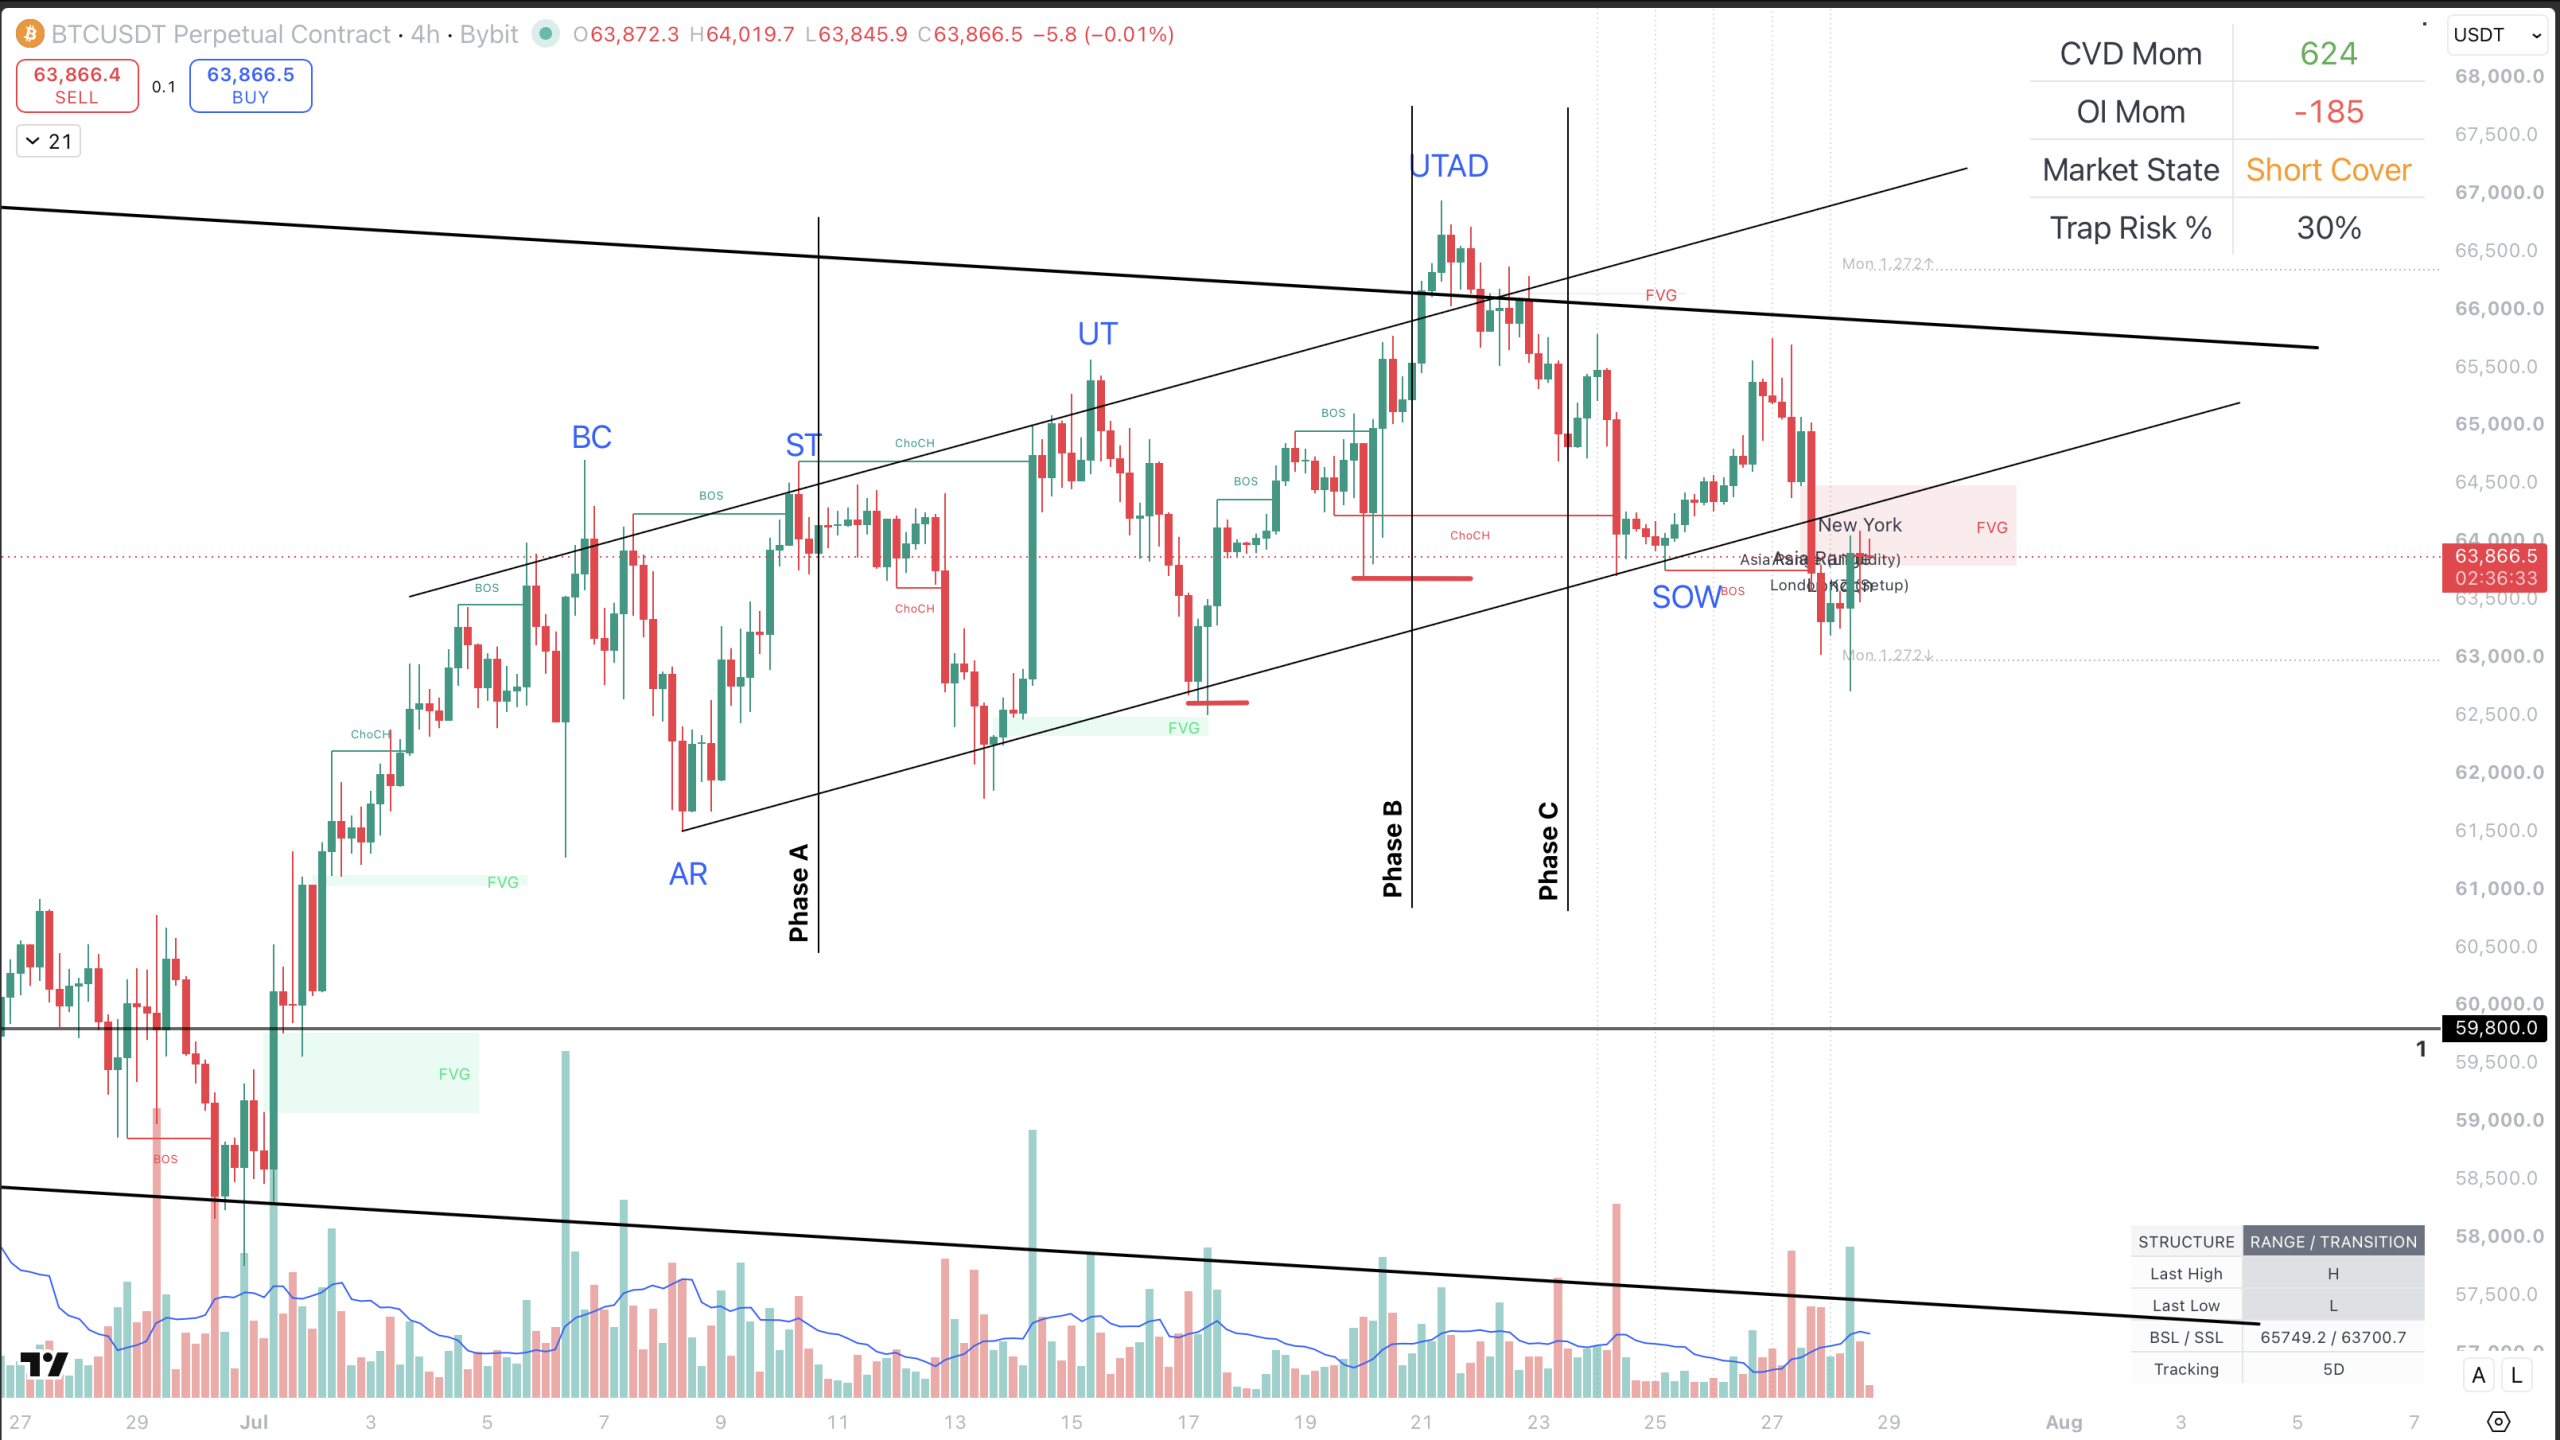
BTCUSDT Perpetual | 12H and 4H | Bybit | July 28, 2026 | New York Time
Bitcoin remains positioned between two unfinished external liquidity objectives.
Buy-side liquidity remains above the recent high, with the previously expected upper objective near 67,300. Below price, the larger 12-hour range continues to expose sell-side liquidity around 59,943–59,800.
The previous working thesis favored the upper liquidity first.
The latest four-hour delivery challenges that sequence.
Price failed to sustain the move following the UTAD candidate, produced a Sign of Weakness, traded beneath local sell-side liquidity, and is now attempting to recover into a nearby bearish Fair Value Gap.
This does not confirm a direct move toward 59,800. It changes the active structural question:
Can Bitcoin reclaim the four-hour imbalance and restore the path toward 67,300, or will the rebound fail and make 59,800 the nearer liquidity draw?
This briefing is based on the supplied 12-hour and four-hour Bybit charts. It is a conditional structural framework, not a directional prediction.
Market Status
| Component | Structural Reading |
|---|---|
| Bias | Conditional bearish; external range unresolved |
| HTF Structure | 12H range below the upper boundary |
| Wyckoff Context | UTAD candidate followed by SOW |
| Local Liquidity | Sell-side liquidity near 63,700 was accessed |
| External Liquidity | 59,943–59,800 below; 67,300 above |
| Active Test | Rebound into the 4H bearish FVG |
| Market State | Short Cover on the supplied indicator |
| Bearish Confirmation | FVG rejection and acceptance below the recent low |
| Bearish Invalidation | 4H acceptance above the FVG and recovery of 65,749 |
| Trade Status | No-trade until rejection or reclaim confirms |
1. Key Structural Problem
The central problem is not whether Bitcoin can bounce after trading below local support.
The bounce has already begun.
The problem is whether that recovery represents accepted bullish repricing or short covering into overhead supply.
On the supplied indicator, CVD momentum is positive while open-interest momentum remains negative. The dashboard classifies the current market state as Short Cover.
That combination suggests that part of the rebound may be driven by existing shorts reducing exposure rather than aggressive new leveraged demand.
This is a structural inference, not proof of participant identity.
The rebound must now demonstrate whether price can recover and hold above the four-hour imbalance. This decision process follows the broader framework established in Why Market Structure Comes First: The StructFirst Trading Framework.
2. HTF Structure
The 12-hour chart remains inside a broad external range.
The principal structural references are:
- the upper range and prior AR region in the mid-to-upper 66,000s;
- the recent UTAD candidate above internal resistance;
- the lower external boundary around 59,943–59,800;
- and the deeper 54,898 reference, which becomes relevant only if the primary range support fails.
The move above internal resistance did not establish sustained acceptance. Price returned beneath the upper boundary and subsequently formed a Sign of Weakness candidate.
This supports a bearish hypothesis, but it does not confirm complete markdown. The larger external range remains intact while the 59,800 boundary holds.
A local bearish shift can develop without immediately breaking the swing that controls the higher-timeframe auction. That distinction is explained in Internal vs External Market Structure: Which Swing Actually Controls the Trend?.
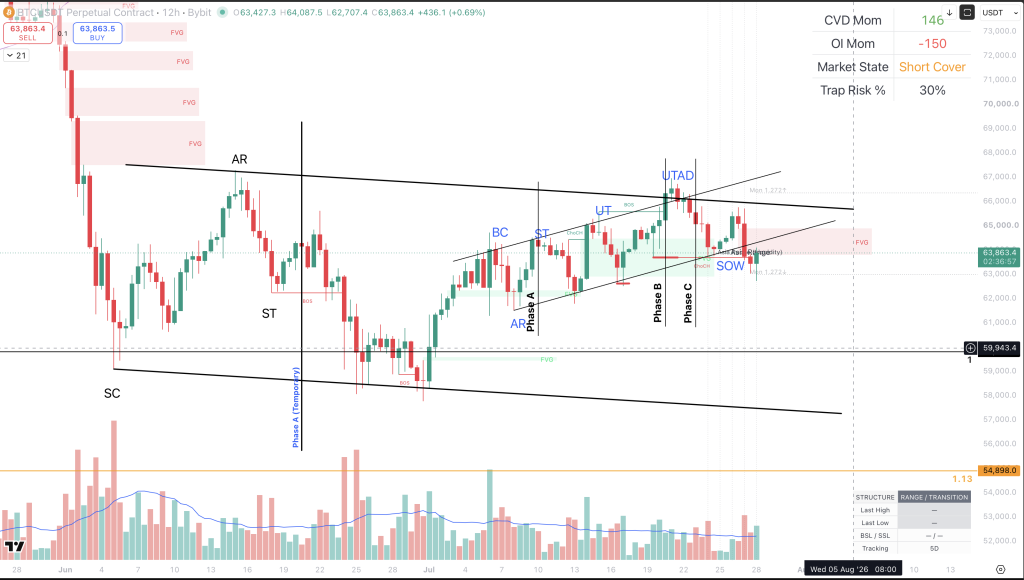
The 12-hour chart shows the full range from the earlier Selling Climax and Automatic Rally through the later internal BC, ST, UT, UTAD candidate, and SOW.
The UTAD candidate becomes structurally meaningful because price failed to maintain acceptance above the internal and external resistance area. The subsequent decline weakened the rising internal structure and returned price toward the lower half of the local channel.
However, the broader lower boundary around 59,943–59,800 has not been tested. The current weakness remains an internal transition inside a larger unresolved range.
3. Liquidity Positioning
Three liquidity layers currently matter.
Local sell-side liquidity
The supplied four-hour chart identifies local sell-side liquidity near 63,700.
Price traded below that level and recovered.
This confirms that the liquidity was accessed. It does not confirm whether the event was a reversal sweep or the beginning of lower acceptance.
The distinction depends on whether price can reclaim the level and hold above it or whether the current rebound fails and price accepts lower. See What Is a Liquidity Sweep? Confirmation, Failure, and Execution.
External sell-side liquidity
The larger lower objective remains around 59,943–59,800.
This is the lower boundary of the 12-hour auction and therefore carries more structural weight than the recently accessed local low.
Unfinished buy-side liquidity
Buy-side liquidity near 65,749 and the larger objective near 67,300 remain unfinished.
User Thesis: Bitcoin was initially expected to access the 67,300 liquidity before rotating lower.
Current Structural Inference: The UTAD candidate, SOW, and local bearish displacement raise the possibility that the order of delivery has changed.
The upper objective has not disappeared. It may simply no longer be the nearest draw.
4. Wyckoff / ICT Context
The UTAD label must remain conditional.
The chart supports a UTAD candidate because price traded above internal resistance, failed to sustain acceptance, and returned into the preceding structure.
The SOW strengthens the weakness hypothesis, but neither label guarantees markdown.
For a bearish Wyckoff sequence to mature, price must:
- fail the current rebound;
- remain below the internal channel recovery level;
- establish acceptance beneath the recent low;
- and continue delivering toward the lower range boundary.
From an ICT perspective, local sell-side liquidity has already been accessed. The active test is whether the bearish FVG acts as resistance or is reclaimed.
A sweep below support followed by FVG acceptance would weaken the bearish case. A failed recovery into the FVG followed by displacement lower would strengthen it.
5. Intent
The rejection from the UTAD region suggests that supply remained active near the upper range.
The current rebound suggests that immediate selling pressure has eased, but the supplied Short Cover reading does not yet establish fresh bullish sponsorship.
Bearish intent becomes more credible through the following sequence:
Local SSL Access
→ Weak Rebound
→ FVG Rejection
→ Bearish Displacement
→ Failed Reclaim
→ Lower Acceptance
Bullish intent becomes more credible through the opposite sequence:
Local SSL Sweep
→ FVG Reclaim
→ Four-Hour Acceptance
→ 65,749 Recovery
→ Upper-Liquidity Continuation
Intent remains inferred until one of these sequences confirms.
6. Confirmation
The lower-first thesis requires more than another bearish candle.
Required confirmation includes:
- rejection from the four-hour bearish FVG;
- failure to sustain price above the 63,700–64,500 recovery area;
- bearish displacement through the recent low;
- candle-body acceptance beneath the rising channel support;
- and a failed retest from below.
A large candle without structural consequence would remain volatility rather than confirmed repricing. The characteristics of valid displacement are explained in What Is Displacement in Trading? Why Strong Candles Alone Are Not Enough.
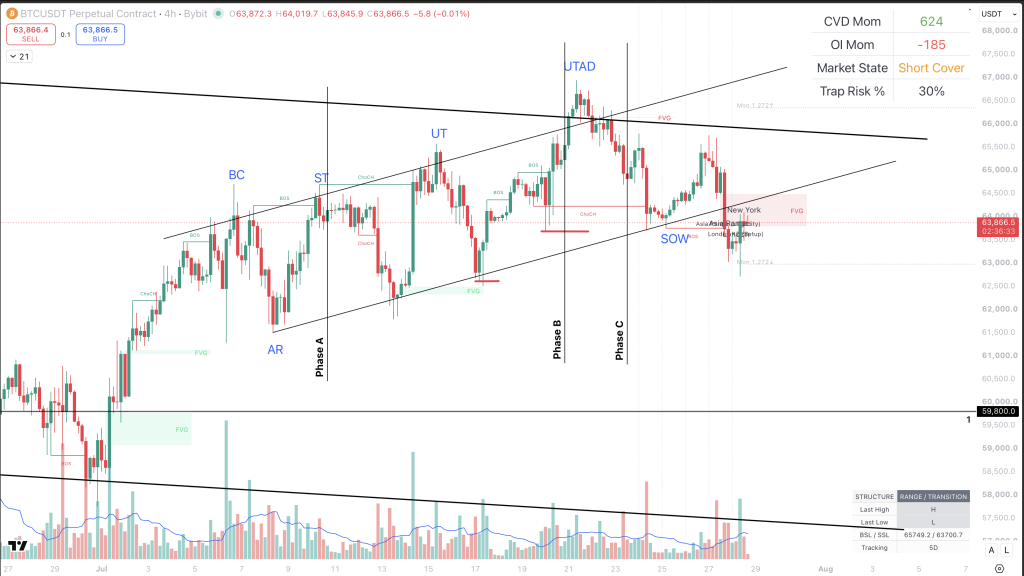
The four-hour chart shows price trading beneath the local 63,700 sell-side reference before rebounding into the lower portion of a bearish FVG.
The response inside this imbalance is more important than the initial liquidity sweep. Rejection would support renewed bearish delivery. Acceptance through the gap would indicate that the market is recovering the area responsible for the previous decline.
A local CHoCH may show that immediate bearish pressure has weakened, but it does not confirm a completed bullish reversal. The distinction between BOS, CHoCH, and a true Market Structure Shift is explained in BOS vs CHoCH vs Market Structure Shift: What Actually Confirms a Trend Change?
The four-hour chart shows price trading beneath the local 63,700 sell-side reference before rebounding into the lower portion of a bearish FVG.
The response inside this imbalance is more important than the initial liquidity sweep. Rejection would support renewed bearish delivery. Acceptance through the gap would indicate that the market is recovering the area responsible for the previous decline.
A local CHoCH may show that immediate bearish pressure has weakened, but it does not confirm a completed bullish reversal. The distinction between BOS, CHoCH, and a true Market Structure Shift is explained in BOS vs CHoCH vs Market Structure Shift: What Actually Confirms a Trend Change?.
7. Invalidation
Invalidation must be defined before assigning lower targets.
The lower-first thesis weakens if price:
- accepts through the four-hour bearish FVG;
- holds above approximately 64,500;
- recovers the local buy-side liquidity near 65,749;
- and converts the current imbalance into support.
A stronger invalidation would occur if price reclaims the upper range structure and returns toward the UTAD region.
The bearish thesis should not be defended after price accepts above the structure that originally justified it.
8. Execution Condition
No short entry is justified solely because the chart contains a UTAD or SOW label.
A conditional short requires:
- rejection from the FVG;
- lower-timeframe bearish displacement;
- failure to reclaim the displacement origin;
- a defined invalidation level;
- and sufficient distance to the next sell-side liquidity objective.
The current imbalance is an area to monitor, not an automatic entry zone. The complete framework is explained in How to Read a Fair Value Gap in Market Structure.
A conditional long requires the opposite evidence:
- recovery through the FVG;
- four-hour acceptance above it;
- preservation during a retest;
- and displacement toward 65,749.
9. Harmonic / PRZ Check
No new completed harmonic pattern is confirmed by the supplied charts.
The visible 1.272 references may provide location context, but they do not create an independent reversal or continuation signal.
Harmonic Status: Unconfirmed and not required for execution.
10. MDA D1–D10 Verification
| Layer | Current Reading |
|---|---|
| D1 | 12H external range remains intact |
| D2 | Upper buy-side liquidity remains unfinished |
| D3 | Local sell-side liquidity has been accessed |
| D4 | UTAD and SOW support a weakness hypothesis |
| D5 | Recovery is classified as Short Cover |
| D6 | Four-hour bearish FVG is under active test |
| D7 | Lower acceptance remains unconfirmed |
| D8 | No efficient execution exists inside the FVG |
| D9 | Acceptance above the FVG invalidates lower-first |
| D10 | No-trade until rejection or reclaim confirms |
The verification result is mixed.
Weakness is visible, but the market has not yet confirmed the next external liquidity objective.
11. Primary Scenario
The primary scenario is conditional lower-first delivery.
It activates only if the rebound fails inside the bearish FVG and price establishes acceptance beneath the recent low.
The expected liquidity sequence would then become:
Recent Four-Hour Low
→ Lower Internal Liquidity in the 62,000s
→ 59,943–59,800 External Sell-Side Liquidity
The 54,898 reference is not an immediate target. It becomes relevant only if the larger 12-hour lower boundary breaks and price establishes acceptance beneath it.
12. Secondary Scenario
The secondary scenario is a bullish reclaim.
If price accepts above the four-hour FVG, recovers 65,749, and holds that recovery during a retest, the recent decline may prove to be a sell-side liquidity event rather than the beginning of sustained markdown.
The upper sequence would then return to:
FVG Reclaim
→ 65,749 Buy-Side Liquidity
→ Upper Range Test
→ 67,300 External Liquidity
If the UTAD candidate, SOW, and lower acceptance instead develop into a complete markdown sequence, the structure would begin to resemble the redistribution process examined in Bitcoin Wyckoff Redistribution: How the 6H Structure Confirmed Markdown.
13. Target Liquidity
Conditional lower targets
- the recent four-hour low;
- internal liquidity in the lower 62,000s;
- external sell-side liquidity around 59,943–59,800.
Conditional upper targets
- the upper boundary of the four-hour FVG;
- local buy-side liquidity near 65,749;
- unfinished external liquidity near 67,300.
Targets remain conditional on confirmation. The nearest visible liquidity is not automatically the next destination.
14. Risk Assessment
Current price is located inside a decision area rather than a clean execution area.
The main risks are:
- shorting after local sell-side liquidity has already been swept;
- buying solely because price bounced;
- treating Short Cover as confirmed accumulation;
- assuming SOW guarantees markdown;
- targeting 59,800 before lower acceptance develops;
- and ignoring the unfinished buy-side liquidity above.
Both scenarios remain active while price trades inside or immediately around the bearish FVG.
15. No-Trade Conditions
No trade is justified while:
- price remains inside the four-hour FVG;
- the local sell-side sweep has not confirmed rejection or acceptance;
- four-hour candle bodies remain above the recent low;
- bearish displacement has not broken relevant structure;
- the FVG has not been reclaimed;
- or invalidation is too wide relative to the remaining liquidity target.
No-trade is the correct decision until price confirms whether the imbalance is resistance or recovery support.
Expand Your Structural Edge
The unfinished liquidity near 67,300 has not disappeared.
The structural order of delivery may be changing.
The UTAD candidate and SOW introduced weakness. The local sell-side liquidity event created a new test. The response inside the four-hour FVG will determine whether 59,800 becomes the nearer external objective or whether the upper-liquidity path is restored.
Do not trade the label.
Trade the confirmed response, define failure before entry, and allow liquidity targets to follow structure.
Track the live order flow and volume footprint yourself directly on TradingView.
Leave a Reply