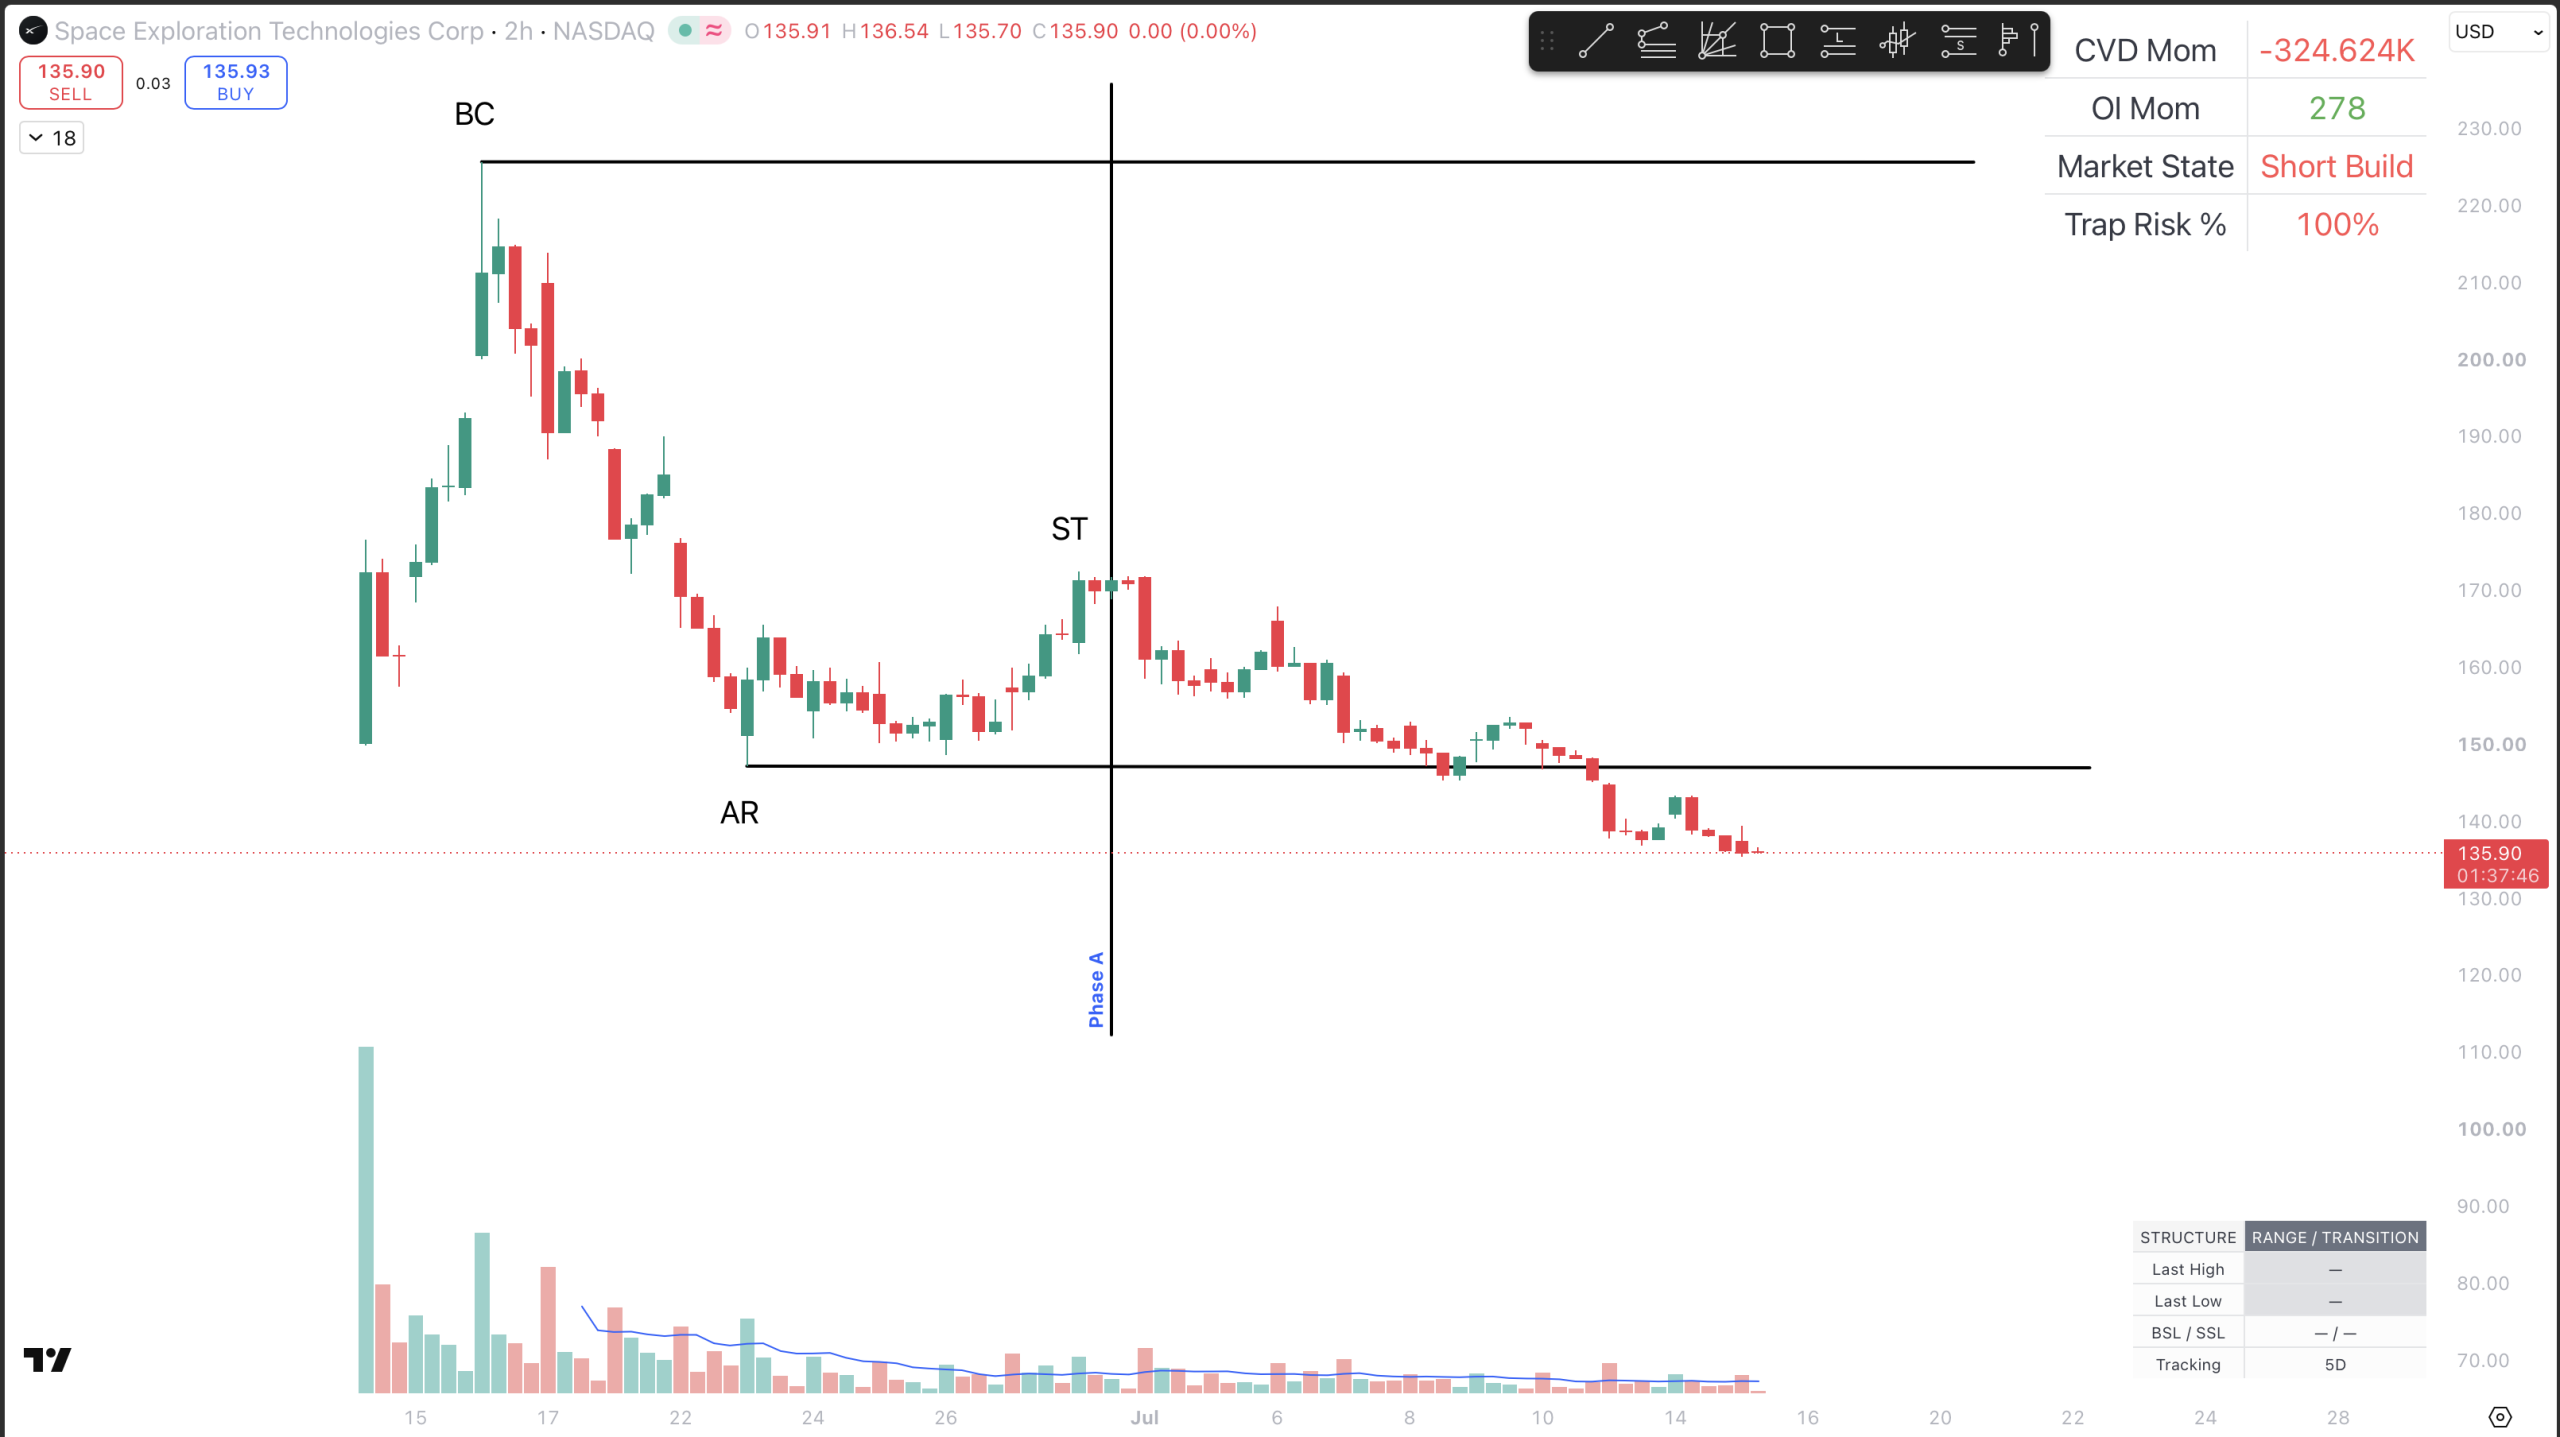
When retail traders see a support level break, they aggressively hit the sell button, convinced that a massive downtrend is underway. However, institutional operators (Smart Money) frequently use these exact moments to engineer a Wyckoff distribution trap to hunt breakout short-sellers and accumulate liquidity.
Today, we are examining a live 2H structural setup on SpaceX (Space Exploration Technologies Corp) that perfectly illustrates the fine line between a genuine structural markdown and an orchestrated Wyckoff distribution trap.
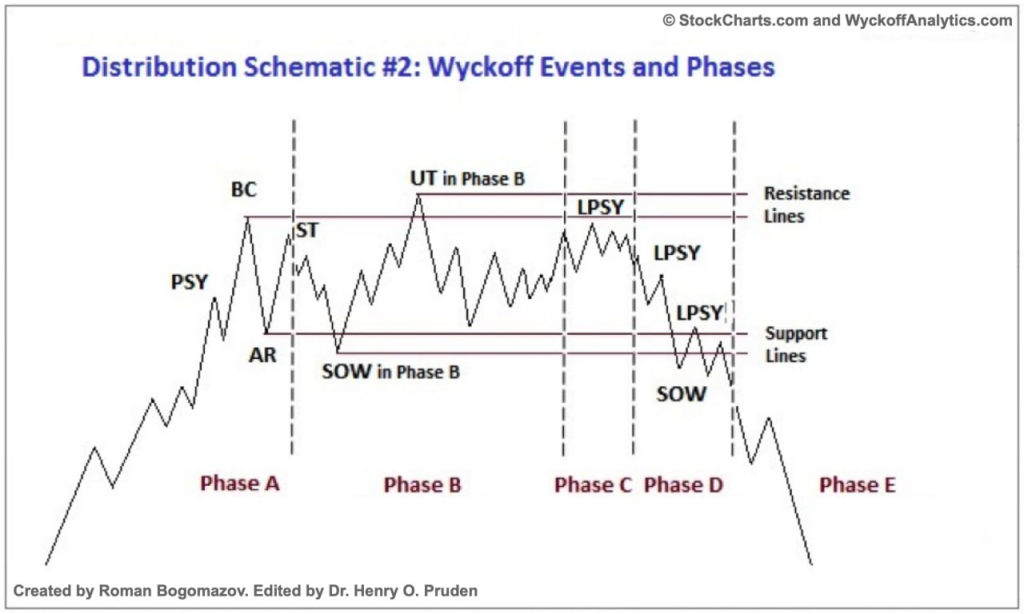
The Anatomy of a Wyckoff Distribution Trap: Phase A to B
To understand the current SpaceX price action and avoid the Wyckoff distribution trap, we must read the structural footprints left by the volume.
- The Buying Climax (BC): The massive vertical spike on the left side of the chart was fueled by retail FOMO. However, the extreme volume indicates that Smart Money was actively providing supply, absorbing the buy orders to build their short inventory.
- The Automatic Reaction (AR): The subsequent sharp decline established the foundational support level of our trading range.
- The Secondary Test (ST): Notice how the ST failed to even challenge the highs of the BC, forming a significant lower high on visibly lower volume. This structural weakness aligns perfectly with a Schematic #2, where demand is entirely exhausted early in the range.
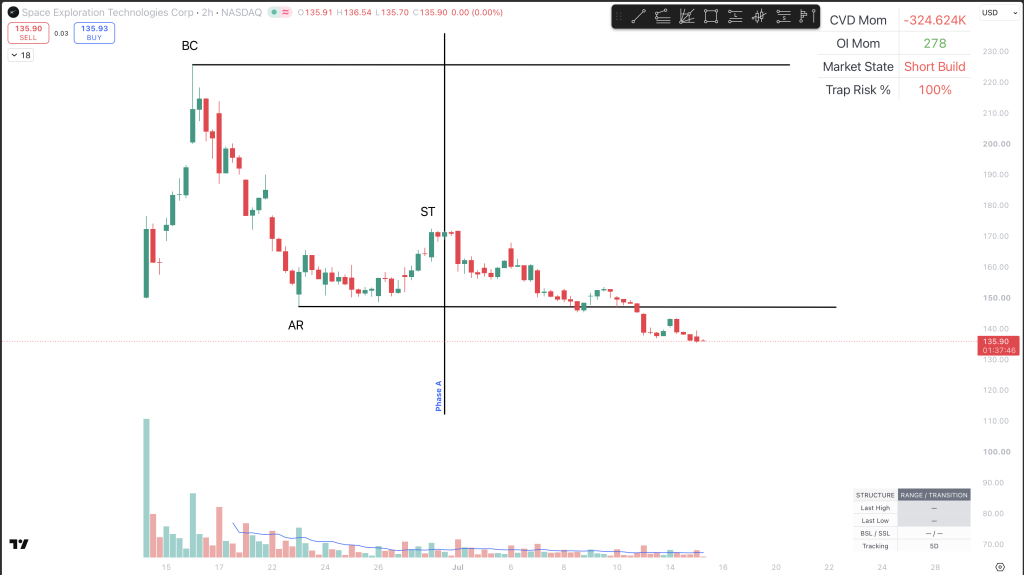
The Structural Problem: A Low-Volume Breakdown
Currently, the SpaceX price has broken below the critical AR support line. The algorithmic footprint indicates a “Short Build” with aggressive negative CVD momentum. For a textbook trader, this is a clear Sign of Weakness (SOW) leading into Phase D.
But we trade structure, not textbooks.
Look closely at the volume profile during this breakdown. The volume is completely dead. A true institutional displacement (a genuine structural shift) requires aggressive selling volume to break the floor. A breakdown at major support on declining volume is an immediate red flag. It presents a 100% risk of a Wyckoff distribution trap.
Smart Money algorithmically drives the price just below the support to trigger retail stop-losses and induce panic shorting, creating a massive pool of liquidity.
Confirmation Over Assumption: The Execution Plan
We do not front-run the breakdown. Shorting into the hole on low volume is retail behavior. We wait for structural confirmation.
- The Bearish Confirmation (LPSY): For this to be a valid short execution, the price must print a Last Point of Supply (LPSY). We need to see a weak rally back toward the underside of the broken AR line, followed by a heavy rejection accompanied by selling volume. Only then do we execute a short position.
- The Bullish Invalidation (The Sweep): If the price abruptly reclaims the AR line with strong volume, closing back inside the range, the bearish thesis is immediately invalidated. This would confirm that the breakdown was merely a Liquidity Sweep (a Wyckoff Spring), potentially setting up a massive re-accumulation rally.
Stop trading the breakout. Start reading the volume and wait for the institution to reveal their true intent.
A Final Word on Risk Management Surviving a Wyckoff
distribution trap requires absolute discipline. Never anticipate the confirmation before it prints on the chart. Keep your invalidation levels strictly defined, protect your capital, and let the Smart Money footprint guide your final execution.
Expand Your Structural Edge
Identifying a Wyckoff distribution trap at the AR support line is only the first step. To completely master the institutional footprint, you must understand the full mechanics of how Smart Money unloads their inventory.
Read our previous deep-dive on the distribution cycle: 🔗 Wyckoff Redistribution: The Smart Money Trap
Track the Live Structure: Do not take our word for it; verify the volume footprint yourself. Track the real-time price action directly on TradingView: 🔗 View the Live SpaceX (2H) Structural Chart
Leave a Reply