Live Briefing #001
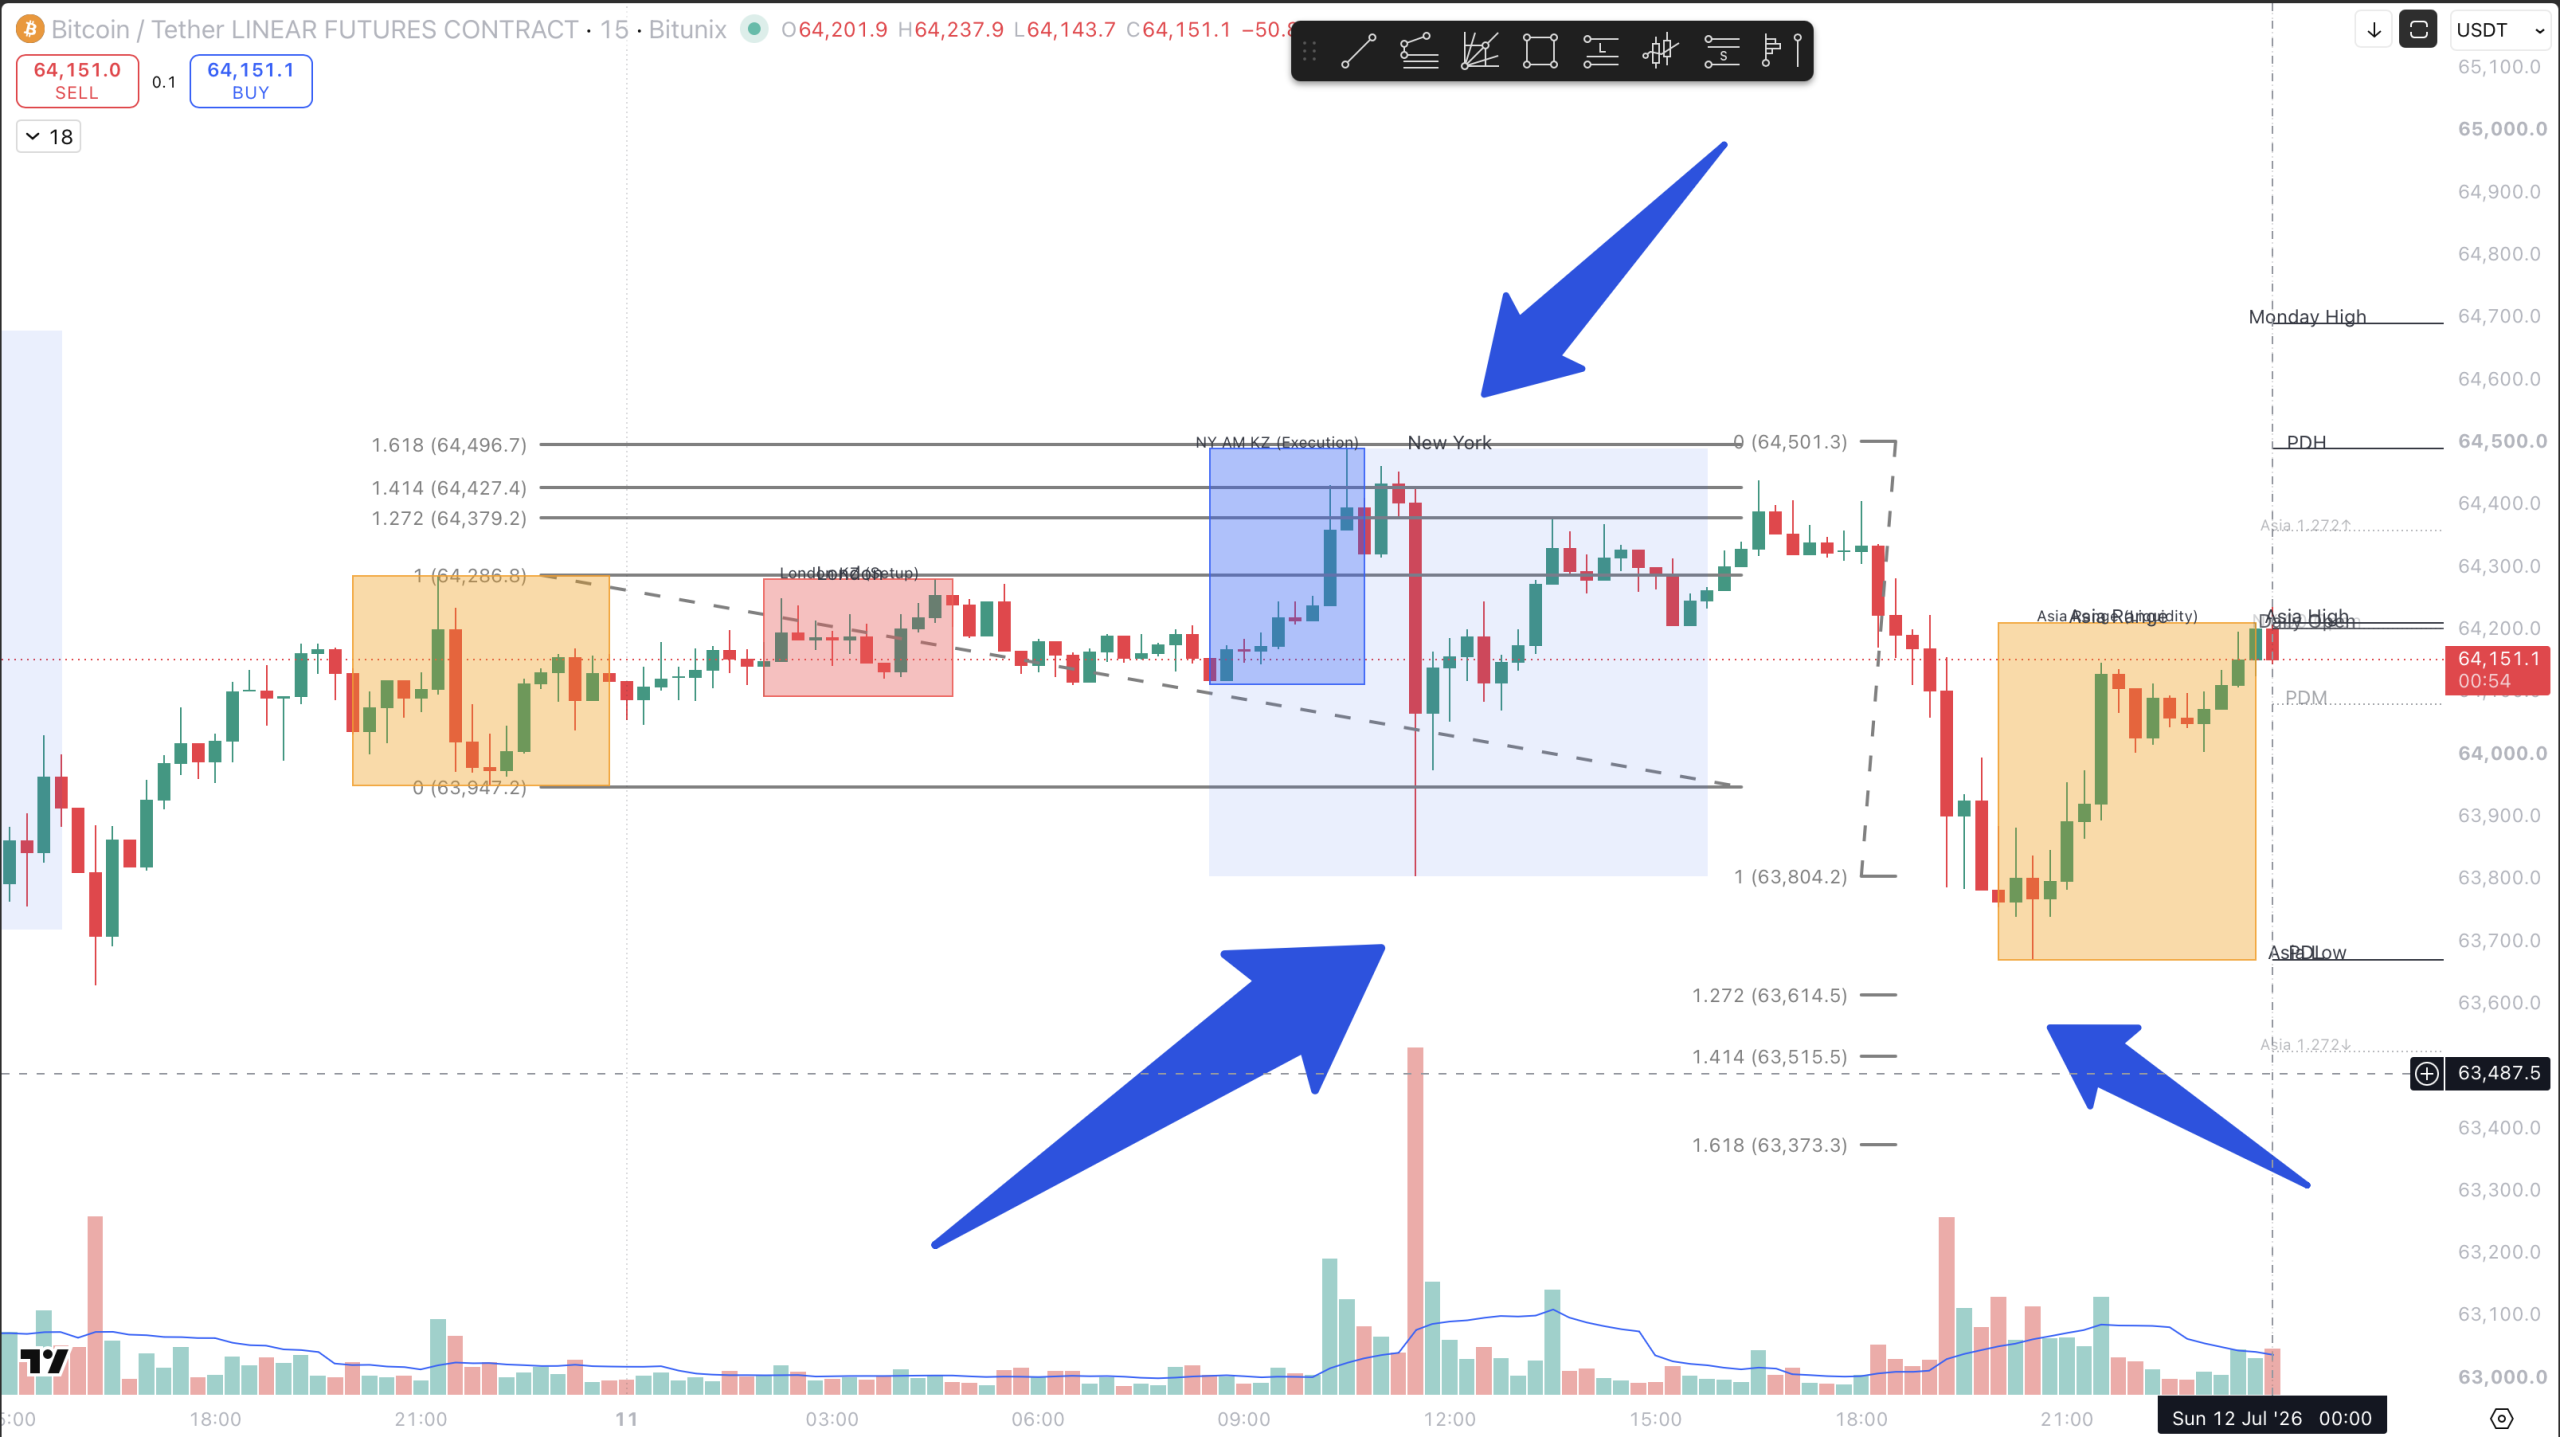
This Bitcoin liquidity trap developed after price swept both sides of the Asian session range near the 1.272–1.618 extension zones.
Archive Note: This Live Briefing documents the market structure visible at the original publication time. It is preserved as a historical execution case study and should not be treated as a current trade signal.
Time & Price Stamp
- Asset: Bitcoin / BTCUSDT Perpetual
- Timeframe: 15-minute
- Snapshot: July 12, 2026, approximately 12:14 a.m. New York time
- Archived Price: Approximately $64,151
- Chart Source: Bitunix
- Key References: Asian session range, previous New York range, 1.272–1.618 extensions
The original chart used Bitunix rather than the standard StructFirst Binance Futures reference. All levels in this archived briefing refer only to the supplied chart.
HTF Structural Context
Bitcoin was trading inside a short-term recovery structure after a broader decline. The 15-minute chart showed active intraday repricing, but it did not independently confirm a higher-timeframe bullish reversal.
The immediate decision area was the Asian session range.
Price first traded above the Asian high and entered the upper 1.272–1.618 extension zone. That expansion accessed buy-side liquidity but failed to establish sustained acceptance above the session boundary.
Bitcoin later rotated through the opposite side of the range, crossed the Asian low, and reached sell-side liquidity beneath the previous New York low.
The key question was not whether Bitcoin had reached a Fibonacci extension. It was whether the lower liquidity sweep would produce rejection and structural reclaim or acceptance beneath the session structure.
Lower-timeframe sweeps must remain subordinate to the controlling structure. The broader analytical hierarchy is explained in the StructFirst Trading Framework.
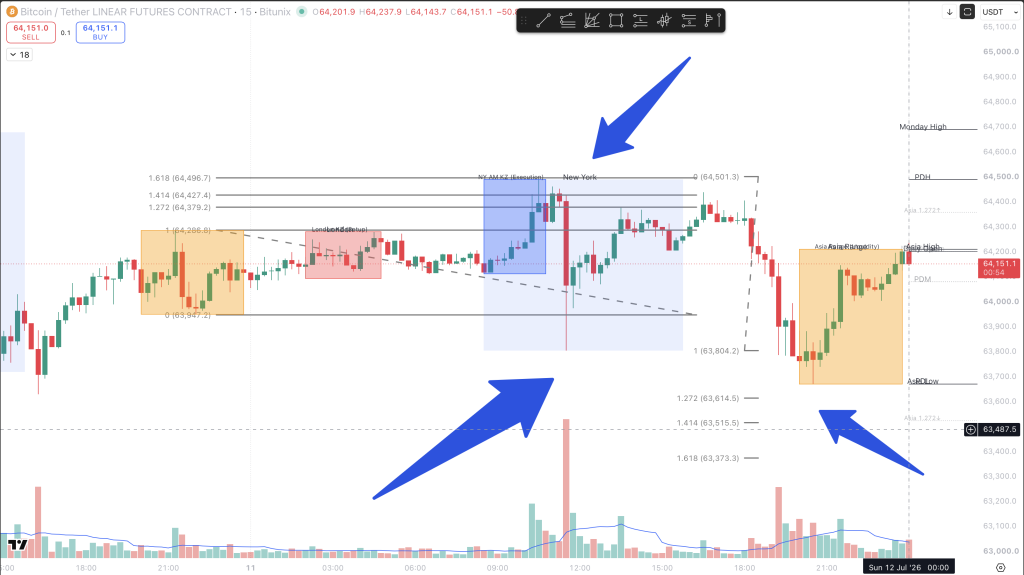
Description: Bitcoin BTCUSDT 15-minute chart showing the Asian session range, New York session expansion, buy-side liquidity above the Asian high, sell-side liquidity below the Asian and previous New York lows, and reaction zones near the 1.272, 1.414, and 1.618 Fibonacci extensions. The chart demonstrates why extension levels identify potential reaction locations but still require failed acceptance, displacement, and structural reclaim before execution.
Liquidity & Intent
Confirmed Observations
- Price traded above the Asian high and entered the upper extension zone.
- The breakout failed to maintain acceptance above the session boundary.
- Bitcoin later crossed below the Asian low.
- Sell-side liquidity beneath the previous New York low was accessed.
- Volume expanded during the major session movements.
- The lower sweep was followed by an attempt to reclaim the broken intraday structure.
Structural Inference
The Asian high, Asian low, and previous New York low acted as visible liquidity references. Protective stops and breakout orders were likely concentrated beyond those boundaries, creating sufficient opposing flow for rapid expansion.
The overlap between session liquidity and the 1.272–1.618 extensions increased the structural importance of the reaction zones.
It did not prove that Bitcoin had to reverse at those ratios.
The extensions identified potential locations. Acceptance or rejection determined the result.
Immediate Setup & Confirmation
At the archived snapshot, the active setup was a conditional long following the sweep beneath the previous New York low.
Required bullish confirmation:
- A 15-minute candle closes back above the swept boundary.
- Bullish displacement develops away from the low.
- The displacement breaks a meaningful lower-timeframe swing high.
- A controlled retest holds above the reclaimed level.
- Price forms a higher low instead of immediately returning beneath the sweep.
A wick below the low confirmed only that price had traded through liquidity. It did not confirm rejection.
Candle-body reclaim, displacement, and follow-through were required. The relationship between wicks, body acceptance, volume, and displacement is explained in Candles Are Footprints.
Bearish Continuation Alternative
The lower sweep could still become bearish continuation if:
- Price remained below the previous New York low
- Bullish displacement failed to develop
- The reclaim was immediately rejected
- Bitcoin began building value beneath the Asian range
- Lower highs continued forming below the broken boundary
A sweep is not automatically a reversal. Failure to reclaim would keep the bearish structure active.
Invalidation & Failure Logic
The bullish reclaim thesis failed if Bitcoin:
- Maintained acceptance below the sweep low
- Lost the origin of bullish displacement
- Failed to hold the reclaimed session boundary
- Produced a lower high beneath the broken level
- Continued building value below the lower extension zone
The approximate structural invalidation on the archived chart was near $63.6K.
This was not an arbitrary stop. Continued acceptance below that area would disprove the rejection-and-reclaim thesis.
The setup could also weaken before final invalidation. Weak displacement, repeated failure above the reclaimed boundary, or an immediate return beneath the Asian low would justify reducing risk or remaining flat.
Target Liquidity & Execution
- Primary target: Asian session high and nearby internal buy-side liquidity around $64.2K
- Secondary target: Previous New York high and prior intraday liquidity around $64.5K
- Execution: Enter only after candle-body reclaim or a controlled retest
- Risk management: Reduce exposure at the first opposing liquidity pool and reassess whether bullish displacement remains intact
- No-Trade Condition: No displacement, failed reclaim, poor reward relative to invalidation, or an entry requiring the trader to chase an extended move
The targets were based on identifiable liquidity pools—not on the Fibonacci extensions alone.
Primary Scenario
The primary scenario was a confirmed bullish reclaim after the sell-side liquidity sweep.
Bitcoin needed to regain the previous New York low, hold above the reclaimed boundary, and continue toward the Asian high. The setup remained valid only while price maintained acceptance above the reclaimed structure.
Secondary Scenario
The secondary scenario was continued acceptance beneath the sweep low.
If Bitcoin failed to reclaim and continued forming lower highs beneath the broken boundary, the liquidity event would represent continuation rather than reversal.
Under that condition, the long thesis was invalid and no countertrend execution was justified.
Risk Assessment
The primary risk was confusing location with confirmation.
The lower extension zone was relevant because it overlapped with identifiable sell-side liquidity. That confluence increased the probability of a reaction but did not guarantee a reversal.
Additional risks included buying the first wick, chasing displacement after the efficient entry had passed, ignoring the broader bearish context, and holding the bullish thesis after price accepted beneath invalidation.
Expand Your Structural Edge
This Bitcoin liquidity trap was not confirmed by the Fibonacci extension alone.
The session boundary identified the liquidity pool. The sweep created the event. Failed acceptance, bullish displacement, structural reclaim, and retest determined whether the setup became executable.
For a complete explanation of this process, read What Is a Liquidity Sweep? Confirmation, Failure, and Execution.
Track the live order flow and volume footprint yourself directly on TradingView.
Leave a Reply